Technical Indicator

Easily Create Custom Neural Network Predictors for MetaTrader 4
MetaTrader4
Easily Create Custom Neural Network Predictors for MetaTrader 4

Author: gpwr, posted on MQL5 If you’re looking to dive into the world of neural network predictors, you’re in the right place! The BNN predictor shared by gpwr is a robust tool, but many traders have been curious about how to tweak the source code to create their own predictors based on different indicators. Well, I’ve got you covered! This modified version of the BNN Predictor allows you to customize it according to your preferred indicators. At the end of the code, you’ll find a function that looks like this: double getValue(int i) { return(iMA(NULL,0,15,0,MODE_SMMA,PRICE_OPEN,i)); } As you can see, this function is set up to predict using a Moving Average. But don’t worry if that’s not your go-to indicator! You can replace the Moving Average with any other indicator you prefer, including your own custom indicators using iCustom(). For instance, if you want to create an RSI predictor, you’d simply change the function to: double getValue(int i) { return(iRSI(NULL,0,14,PRICE_OPEN,i)); } Installation Steps: Copy BPNN.DLL to your experts/libraries/ folder. Make sure to configure MetaTrader 4 to allow DLL imports by going to Tools > Options > Expert Advisors and checking the box for Allow DLL imports. 
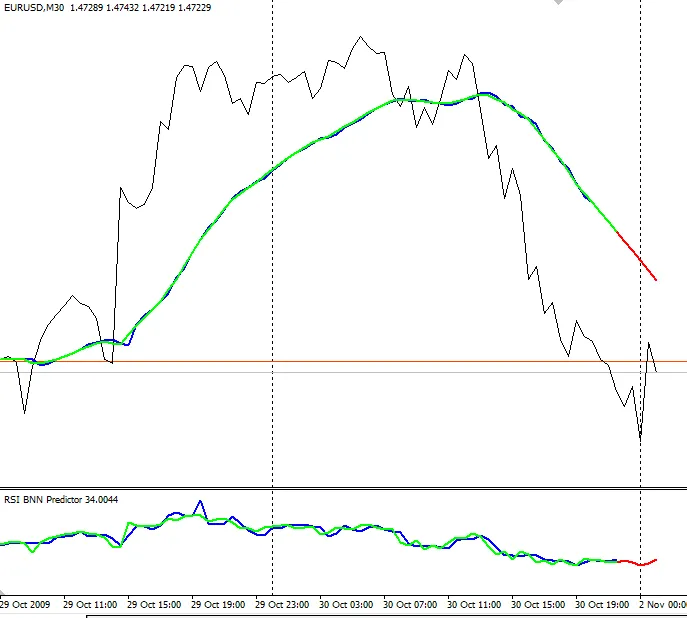
MA Predictor and RSI predictor on EURUSD M30 Recommendations: If you have questions specifically about the neural network, please reach out to the original author, gpwr, as I've only modified the code for easier customization. If you need assistance adapting an indicator, feel free to ask me! Just remember to stick to English, French, Spanish, or Portuguese for our conversation. The examples provided, MA and RSI, are just starting points. They do not include external variables for changing periods or other settings, but you can expand on them as needed.

2009.11.04
Mastering the Two Pole Smoothed Ehlers Oscillator for Better Trading
MetaTrader4
Mastering the Two Pole Smoothed Ehlers Oscillator for Better Trading

Author: Originally researched by John F. Ehlers, as detailed in his book "Cybernetic Analysis for Stocks and Futures" (2004) ISBN: 0-471-46307-8. The Two Pole Super Smoother Indicator, inspired by Ehlers' work, has been skillfully coded by Witold Wozniak (www.mqlsoft.com). Further contributions and enhancements were made by Julien Loutre (zenhop). So, what’s the deal with the Two Pole Super Smoother Indicator? It’s a fantastic tool for assessing trends and serves as a solid alternative to the regular moving average. However, it’s not the best at pinpointing the major cycle turning points. To amp up its effectiveness, I’ve transformed the Super Smoother Indicator into a smoothed oscillator. This new oscillator does a stellar job of identifying most cycle turning points while filtering out that annoying residual noise. To tackle the noise issue, I employed Ehlers' Instantaneous Trendline Filter. This filter is brilliant at reducing noise while keeping lag to a minimum. Because the math has been tweaked to focus on Open prices, this indicator won’t retrace, which is a huge advantage. Lag: Keep in mind that the original Two Pole Super Smoother Indicator does have a slight lag, which is proportional to its Cutoff Period. However, since this version is based on Open prices (to avoid retracements), it adds one bar of lag. Additionally, the Instantaneous Trendline Filter contributes a bit of lag too, but it shouldn’t exceed two bars. So, steer clear of using this indicator for cycles shorter than 10 bars. If you’re trying to catch 5-bar cycles on the H1 timeframe, consider using this indicator on M1 or M5 with a larger Cutoff period. The additional data from smaller timeframes lets you trade those short cycles effectively. Take a look at the screenshot below to see how the oscillator accurately identifies the turning points of most cycles. EURUSD M30 with CutOff=48 (24 hours, daily cycle) and alpha=0.07 Ehlers' CyberCycle allows you to evaluate the quality of the signal. Ehlers' CG also allows you to evaluate the quality of the signal (Period=24 (half the target cycle's period)) Recommendations: This indicator can be quite accurate, but remember it’s not magic. Always confirm signals with other indicators (DSP indicators work well). Ehlers' CyberCycle is a fantastic filter for signals. Just make sure to use the same alpha in both indicators. Ehlers' CG (Center of Gravity) is another great tool for filtering signals. Use CG's period equal to the Oscillator's Cutoff divided by 2. While using an adaptive indicator (like Adaptive CyberCycle or Adaptive CG) can be beneficial, keep in mind that they may not sync up with this indicator, potentially leading to extra noise. This indicator shines when detecting cycles of 30 bars or longer. Its accuracy can drop when you try to use it for shorter cycles.

2009.11.04
Mastering the Hodrick Prescott Indicator for MetaTrader 4
MetaTrader4
Mastering the Hodrick Prescott Indicator for MetaTrader 4

What is the Hodrick Prescott Filter? The Hodrick Prescott Filter (HPF) is a handy tool for traders looking to smooth out the ups and downs in economic data. While it’s primarily used for static economic series, it works wonders in the dynamic world of FOREX, constantly adjusting to market conditions. The attached indicator acts like a Moving Average, displaying the HPF value for each bar without repainting, making it a reliable choice for your trading strategy. Key Features of the Hodrick Prescott Indicator Here are some of the standout features of this HPF indicator: Market Trend Visualization: It helps identify market trends based on a customizable trend strength. HPF Display Options: You can choose whether to display the HPF on your chart. Multiple Bands: It can show up to two bands centered on the Moving Average or the HPF. Multi-Timeframe Support: Analyze trends across different timeframes effortlessly. Inputs You Can Customize To get the most out of the HPF, you’ll want to tweak a few settings: nobs: This sets the number of HPF bars to consider. lambda: The damping factor for more accurate calculations. timeframe: Select the timeframe you want to apply the HPF to. price: This defines the price for evaluating the HPF, similar to using iMA(). delay: Adjusts the HPF by delaying or advancing it to see potential trends. trend: Choose how many consecutive HPF bars to analyze for trend strength. future: Displays potential future HPF bars for forecasting. bands: Set the number of bars for band calculations. If greater than 0, bands will be displayed. band#: Defines the deviation for each band; if negative, it centers on the HPF. type#: Specifies the type of band (e.g., HPF, applied price, mean, etc.). repaint: If enabled, processes each tick for real-time adjustments. points: If true, it marks up/down trends on the Moving Average. alerts: Turn on alerts to get notified of important changes. audio: Specify a .WAV file for audio alerts. history: Select how many historical bars to process; setting it to 0 will load all history (may take longer). In Conclusion The Hodrick Prescott Indicator is a powerful tool for any trader looking to refine their analysis and improve their decision-making in the FOREX market. With its customizable features and real-time capabilities, it’s definitely worth adding to your trading toolkit. Happy trading!

2009.10.23
Unlocking the Linear_Sinus_FT Indicator for MetaTrader 4: A Guide for Traders
MetaTrader4
Unlocking the Linear_Sinus_FT Indicator for MetaTrader 4: A Guide for Traders

The Linear_Sinus_FT is a unique sinusoidal wave approximation indicator designed for MetaTrader 4. This indicator was inspired by the emergence of tools that decompose quotes into Fourier series, subsequently shifting the results back. It approximates the missing data on the right edge of the chart using a polynomial of no more than the third degree, connecting at the point of discontinuity with a tangent line. The pitfalls of these graphs are well-known. The right edge of the chart fluctuates based on changing quotes, which can lead to misleading signals—first indicating a downward trend, then an upward one, and back again. However, when back-tested, this approach often looks promising. What sets the Linear_Sinus_FT indicator apart is its stability; it remains unchanged regardless of historical data alterations. The foundation is built on Metastock's calculation of sinusoidally weighted moving averages. The result is slightly different from a fast Fourier transform, but the computation speed is significantly improved. We calculate from 0 to n bars, generating a fast Fourier transform (FFT) chart, which is then shifted to the left. A tangent line is drawn at the right edge of the chart, and the indicator value at bar 0 is determined. This process is repeated for all points on the chart from 1 to n+1. The final calculation point is n (calculating from n to n+n). This provides a forecasted value for the chart from point n to point 0, using data from n+n to 0. We then approximate these data points with a second-degree polynomial. Setting the Period for Chart Display An external variable allows you to define the period for the chart display. For shorter periods, consider reducing the value accordingly. Channel Trading Strategy One effective way to utilize this indicator is by constructing channels. Start by identifying the trend direction and trade in that direction. Execute trades outside the channel marked by red lines—buying at the bottom and selling at the top. Avoid purchasing when prices exceed the midpoint of the channel. Happy trading!

2009.10.21
ImpulseOsMA: A Game-Changing Indicator for MetaTrader 4
MetaTrader4
ImpulseOsMA: A Game-Changing Indicator for MetaTrader 4

Description: Have you ever found yourself searching for the perfect indicator that paints bars based on Alexander Elder's impulse system? I know I have! After digging around online, I stumbled upon a couple of options, but they just didn’t cut it. One of the closest indicators I found can be found here. However, that one colors bars based on the MACD line and its signal line, while Elder’s method suggests coloring bars based on the price moving average and the MACD oscillator. After some thought, I decided to create my own indicator that would meet my needs perfectly. The result? A unique blend of MACD, the MACD histogram, and an impulse system. Here’s how it works: The histogram bar turns green when both the histogram and the price moving average are rising simultaneously. The histogram bar turns red when both the histogram and the price moving average are falling simultaneously. The histogram bar turns blue when the histogram and the price moving average are moving in opposite directions. Alexander Elder refers to this system as a censorship system: when the bar is green, selling is off-limits; when it’s red, buying is a no-go; and when it’s blue, the restrictions are lifted. Here are the parameters for the indicator: FastEMA, SlowEMA, SignalEMA: These are the MACD parameters. MAPeriod: This is the period for the simple moving average based on price. MAMode: This defines the method for calculating the moving average: 0 for SMA and 1 for EMA. In the standard MACD indicator provided by MetaTrader, the signal line is calculated using SMA, but in my version, I’ve opted for EMA, just as the original MACD creator recommended. Image:

2009.10.03
First Previous 343 344 345 346 347 348 349 350 351 352 353 Next Last