Overview of the Colored MA Indicator
The Colored MA, or Color Moving Average, is a fresh take on the traditional moving average. This innovative tool draws an exponential moving average (EMA) for a specified period, using different colors to indicate price movements—both up and down.
Essentially, it allows traders to visualize trends more effectively at a glance, making it easier to spot potential trading opportunities.
How to Use the Colored MA
This indicator can be a valuable asset in developing your trading strategy (TS). Below is an example of the Colored MA showcasing three different settings:
- Fat - the fastest response, with a period of 24
- Thin - with a period of 182
- Dotted - the slowest, with a period of 6000
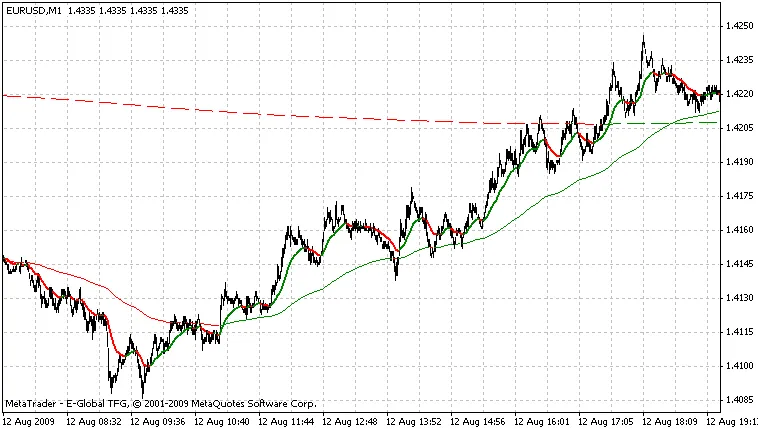
The Fat (24) line reacts quickly to price fluctuations, making it a great tool for spotting immediate trends.
Meanwhile, the Thin (182) line—remaining in its former GREEN state—suggests that any RED dips are merely corrections within a larger GREEN trend, indicating an overall upward trajectory.
Lastly, the Dotted (6000) line clearly highlights a downward global trend, serving as a constant reminder of the prevailing market sentiment.
Related Posts
- Unlocking MetaCOT 2: Your Ultimate CFTC Indicator Toolkit for MT4
- Unlocking the Power of Master Tools for MetaTrader 4
- Unlock Trading Insights with Volume Profile + Range v6.0 for MetaTrader 5
- Mastering the MACD Candle Indicator for MetaTrader 4
- Hourly Buffers for Data Collection in MetaTrader 5: A Simple Guide