The Linear_Sinus_FT is a unique sinusoidal wave approximation indicator designed for MetaTrader 4.
This indicator was inspired by the emergence of tools that decompose quotes into Fourier series, subsequently shifting the results back. It approximates the missing data on the right edge of the chart using a polynomial of no more than the third degree, connecting at the point of discontinuity with a tangent line.
The pitfalls of these graphs are well-known. The right edge of the chart fluctuates based on changing quotes, which can lead to misleading signals—first indicating a downward trend, then an upward one, and back again. However, when back-tested, this approach often looks promising.
What sets the Linear_Sinus_FT indicator apart is its stability; it remains unchanged regardless of historical data alterations. The foundation is built on Metastock's calculation of sinusoidally weighted moving averages. The result is slightly different from a fast Fourier transform, but the computation speed is significantly improved. We calculate from 0 to n bars, generating a fast Fourier transform (FFT) chart, which is then shifted to the left. A tangent line is drawn at the right edge of the chart, and the indicator value at bar 0 is determined. This process is repeated for all points on the chart from 1 to n+1.
The final calculation point is n (calculating from n to n+n). This provides a forecasted value for the chart from point n to point 0, using data from n+n to 0. We then approximate these data points with a second-degree polynomial.
Setting the Period for Chart Display
An external variable allows you to define the period for the chart display. For shorter periods, consider reducing the value accordingly.
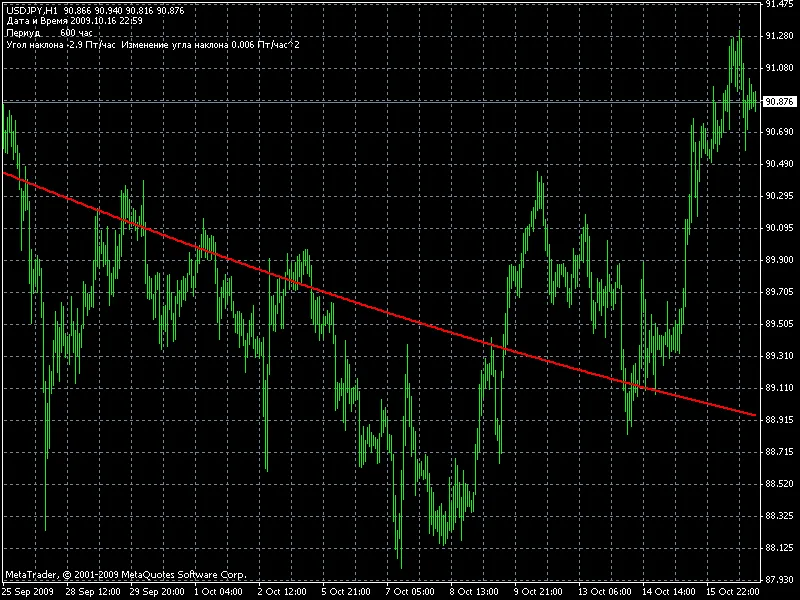
Channel Trading Strategy
One effective way to utilize this indicator is by constructing channels. Start by identifying the trend direction and trade in that direction. Execute trades outside the channel marked by red lines—buying at the bottom and selling at the top. Avoid purchasing when prices exceed the midpoint of the channel.
Happy trading!
Related Posts
- Unlocking MetaCOT 2: Your Ultimate CFTC Indicator Toolkit for MT4
- Unlock Trading Insights with Volume Profile + Range v6.0 for MetaTrader 5
- Unlocking the Power of Master Tools for MetaTrader 4
- Mastering the MACD Candle Indicator for MetaTrader 4
- Visualize Current Trends Across All Time Frames with This MetaTrader 4 Indicator