Author: Vladimir Hlystov
Introducing the Multi-Timeframe Trend Indicator
This handy indicator displays a comprehensive trend table for multiple timeframes right in the bottom left corner of your MetaTrader 4 chart.
As traders, we often find ourselves analyzing several timeframes before making a trade. This helps us gauge the current trend and confirms our trading decisions. However, this process can be time-consuming, and there's always a chance of misreading the trend.
That's where this indicator comes in. It evaluates all timeframes using various trend analysis methods and presents a clear summary in a matrix format on your chart.
How It Works
This trend indicator utilizes four distinct methods for trend determination:
- 0: Based on offset indicators
- 1: Average price analysis with an offset
- 2: Moving Averages (MA) method: If MA 5 is above 13 and 34, the trend is upward; if below, it's downward; and if it’s between 13 and 34, it's considered flat.
- 3: MACD analysis using parameters 5/34/5
If you have your own trend analysis method you'd like to incorporate, feel free to reach out to me!
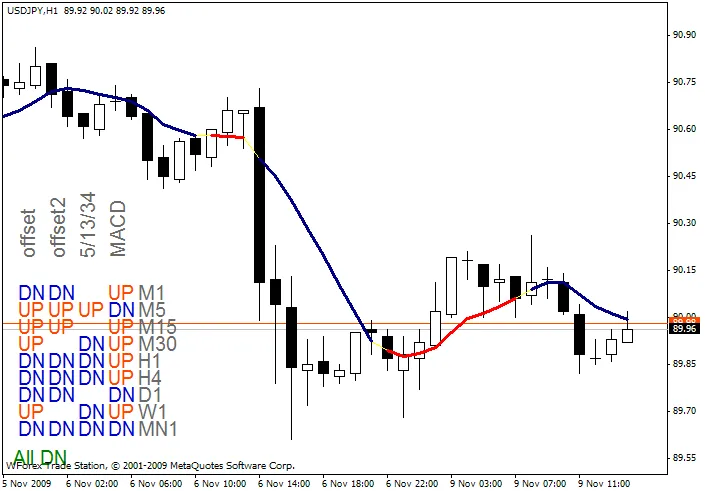
Fig 1. The trend matrix for JPY
Related Posts
- Unlocking MetaCOT 2: Your Ultimate CFTC Indicator Toolkit for MT4
- Unlocking the Power of Master Tools for MetaTrader 4
- Visualize Current Trends Across All Time Frames with This MetaTrader 4 Indicator
- Mastering the Open Range Breakout Indicator for MetaTrader 5
- Unlocking Trading Insights with Volume Profile + Range v6.0 for MetaTrader 5