Technical Indicator

Mastering the Ultimate Oscillator: Your Guide for MetaTrader 5
MetaTrader5
Mastering the Ultimate Oscillator: Your Guide for MetaTrader 5

If you're diving into the world of trading, you’ve probably come across various oscillators. They typically compare the smoothed price of a financial instrument with its value from several periods back. Larry Williams, a notable figure in trading, pointed out that the effectiveness of these oscillators can vary based on the number of periods selected for calculation. This insight led him to develop the Ultimate Oscillator, which cleverly combines three oscillators with different calculation periods. Larry first introduced this oscillator back in 1985 through an article in "Technical Analysis of Stocks and Commodities". The Ultimate Oscillator generates values ranging from 0 to 100, with 50 being the midpoint. If the indicator dips below 30, it signals an overbought condition, while values between 70 and 100 indicate an oversold condition.By default, you can set the oscillator to three time periods: 7, 14, and 28 bars. Remember that longer periods include the data from shorter ones, meaning the 28-period values will take into account the 14 and 7-period values. Thus, the 7-period data has the most significant influence on the oscillator's result. According to Larry Williams, the key to successful trading with this oscillator lies in spotting divergences. When to Buy: Look for a bullish divergence: the prices hit a lower low that isn’t confirmed by a corresponding lower low in the oscillator. The oscillator must drop below 30 during this bullish divergence. Wait for the oscillator to rise above the highest level it reached during the bullish divergence. That’s your cue to buy! To close your long positions, keep an eye out for the following: If the oscillator climbs above 50 and then dips below 45. When it goes above 70 (sometimes it’s wise to wait until it drops back below 70). If you see sell signals popping up. When to Sell: Look for a bearish divergence: the prices establish a higher high that isn’t confirmed by a corresponding higher high from the oscillator. The oscillator should rise above 50 during this bearish divergence. Finally, ensure the oscillator drops below the highest level it reached during the formation of the bearish divergence. To close your short positions, watch for these signs: If the oscillator climbs above 65. When it dips below 30. If buy signals start to emerge. Ultimate Oscillator How to Calculate the Ultimate Oscillator: 1. Determine the current "True Low" (TL), which is the lesser of the current low and the previous closing price. TL (i) = MIN (LOW (i) || CLOSE (i - 1)) 2. Calculate the current "Buying Pressure" (BP), which is the difference between the current closing price and the current True Low. BP (i) = CLOSE (i) - TL (i) 3. Define the "True Range" (TR), which is the highest value among the following differences: current high minus low; current high minus previous close; current low minus previous close. TR (i) = MAX (HIGH (i) - LOW (i) || HIGH (i) - CLOSE (i - 1) || CLOSE (i - 1) - LOW (i)) 4. Sum the BP values across all three calculation periods: BPSUM (N) = SUM (BP (i), i) 5. Sum the TR values across all three calculation periods: TRSUM (N) = SUM (TR (i), i) 6. Calculate the "Raw Ultimate Oscillator" (RawUO): RawUO = 4 * (BPSUM (1) / TRSUM (1)) + 2 * (BPSUM (2) / TRSUM (2)) + (BPSUM (3) / TRSUM (3)) 7. Finally, calculate the "Ultimate Oscillator" (UO): UO = ( RawUO / (4 + 2 + 1)) * 100 Where: MIN means the minimum value; MAX refers to the maximum value; || represents a logical OR; LOW (i) is the minimum price of the current bar; HIGH (i) is the maximum price of the current bar; CLOSE (i) is the closing price of the current bar; CLOSE (i - 1) is the closing price of the previous bar; TL (i) is the True Low; BP (i) denotes the Buying Pressure; TR (i) signifies the True Range; BPSUM (N) is the sum of BP values for an n period; TRSUM (N) is the sum of TR values for an n period; RawUO stands for the Raw Ultimate Oscillator; UO represents the Ultimate Oscillator.

2010.01.26
Mastering the Stochastic Oscillator: A Key Tool for MetaTrader 5 Traders
MetaTrader5
Mastering the Stochastic Oscillator: A Key Tool for MetaTrader 5 Traders

The Stochastic Oscillator is a powerful technical indicator that helps traders assess where a security's price closes relative to its price range over a specific time frame. This indicator is represented by two lines: the main line, known as %K, and a second line, called %D, which is essentially a Moving Average of %K. Typically, the %K line is shown as a solid line, while %D appears as a dotted line. There are several ways to interpret the Stochastic Oscillator. Here are three popular strategies: Buy when the Oscillator (either %K or %D) dips below a certain level (like 20) and then crosses back above that level. Conversely, sell when the Oscillator climbs above a certain level (such as 80) and then drops below it; Buy when the %K line crosses above the %D line, and sell when the %K line dips below the %D line; Watch for divergences, such as when prices are hitting new highs while the Stochastic Oscillator fails to reach new highs. Stochastic Oscillator Calculation: To effectively use the Stochastic Oscillator, it’s important to understand its four key variables: %K period: This indicates the number of periods used in the stochastic calculation; %K Slowing Period: This value determines the internal smoothing of %K. A value of 1 is a fast stochastic, while 3 is considered slow; %D period: This is the number of periods used to calculate the moving average of %K; %D smoothing method: This refers to the method (e.g., Exponential, Simple, Smoothed, or Weighted) used for calculating %D. The formula for %K is as follows: %K = (CLOSE - LOW(%K)) / (HIGH(%K) - LOW(%K)) * 100 Where: CLOSE - represents today’s closing price; LOW(%K) - the lowest low over the %K periods; HIGH(%K) - the highest high over the %K periods. The %D moving average is calculated using the formula: %D = SMA(%K, N) Where: N - is the smoothing period; SMA - stands for Simple Moving Average.

2010.01.26
Understanding Standard Deviation (StdDev) in MetaTrader 5: A Trader's Guide
MetaTrader5
Understanding Standard Deviation (StdDev) in MetaTrader 5: A Trader's Guide

Hey traders! Today, we’re diving into a handy technical indicator that every trader should have in their toolbox: Standard Deviation (commonly referred to as StdDev). This indicator is all about measuring market volatility. So, what’s the deal with StdDev? It helps us understand the scale of price fluctuations compared to the Moving Average. If you notice a large StdDev value, it indicates that the market is quite volatile, with price bars straying far from that moving average. On the flip side, a low StdDev value suggests that the market is calm, with prices clustering around the moving average. Typically, traders use this indicator in conjunction with others. For example, when calculating Bollinger Bands, the StdDev value is added to the Moving Average to create those bands we all know and love. Market behavior tends to ebb and flow, swinging between high trading activity and sluggish periods. Here’s how to interpret StdDev: If the StdDev value is too low, it usually indicates that the market is pretty quiet, which often suggests a potential spike in activity is on the horizon. Conversely, if the StdDev value is extremely high, it’s likely that the market is about to take a breather and activity may slow down soon. Calculation: StdDev (i) = SQRT (AMOUNT (j = i - N, i) / N)AMOUNT (j = i - N, i) = SUM ((ApPRICE (j) - MA (ApPRICE , N, i)) ^ 2) Where: StdDev (i) - Standard Deviation of the current bar; SQRT - square root; AMOUNT(j = i - N, i) - sum of squares from j = i - N to i; N - smoothing period; ApPRICE (j) - the applied price of the j-th bar; MA (ApPRICE (i), N, i) - any moving average of the current bar for N periods; ApPRICE (i) - the applied price of the current bar.

2010.01.26
Understanding the Relative Vigor Index (RVI) for Better Trading Decisions
MetaTrader5
Understanding the Relative Vigor Index (RVI) for Better Trading Decisions

If you're diving into the world of trading, you've probably come across the Relative Vigor Index (RVI). This nifty technical indicator helps traders gauge market momentum by comparing the closing and opening prices. Here’s the scoop: in a bullish market, the closing price typically exceeds the opening price, while in a bearish market, it’s the opposite. Essentially, the RVI measures the energy or 'vigor' behind price movements based on where prices end at the close. To keep things balanced with the daily trading range, the RVI normalizes price changes by dividing the price difference by the maximum price range for the day. To smooth out the calculations, we often use a Simple Moving Average, and a period of 10 is generally ideal. To add clarity, a signal line is constructed, using a 4-period symmetrically weighted moving average of the RVI values. When these lines align, it signals a potential buy or sell opportunity. 
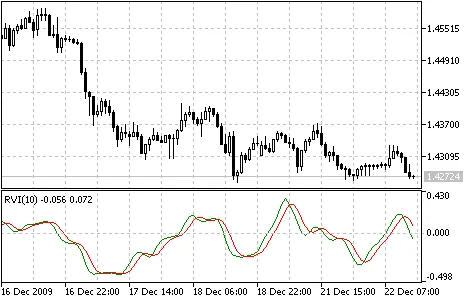
Relative Vigor Index Indicator How to Calculate RVI: 
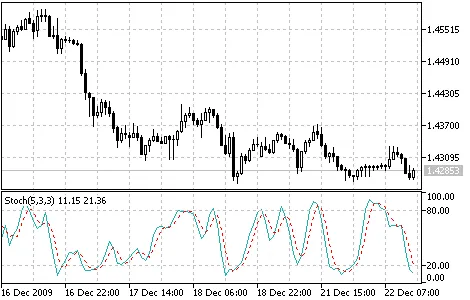
To get a handle on the RVI, you'll find it's calculated much like the Stochastic Oscillator. However, while the Stochastic focuses on the minimum price, the RVI compares closing levels to opening levels. The formula you’ll use is: RVI = (CLOSE - OPEN) / (HIGH - LOW) Where: OPEN - Opening price;HIGH - Highest price;LOW - Lowest price;CLOSE - Closing price. Typically, the RVI is represented by two lines: 1. The first line is calculated similarly to the RVI, but instead of using the close and open prices, you’ll use the sums of 4-period symmetrically weighted moving averages: MovAverage = (CLOSE-OPEN) + 2 * (CLOSE-1 - OPEN-1) + 2 * (CLOSE-2 - OPEN-2) + (CLOSE-3 - OPEN-3) Where: CLOSE - Current close price; CLOSE-1, CLOSE-2, CLOSE-3 - Close prices from 1, 2, and 3 periods ago; OPEN - Current open price; OPEN-1, OPEN-2, OPEN-3 - Open prices from 1, 2, and 3 periods ago. Next, you’ll calculate the 4-period symmetrically weighted moving average of the denominator: RangeAverage = (HIGH-LOW) + 2 x (HIGH-1 - LOW-1) + 2 x (HIGH-2 - LOW-2) + (HIGH-3 - LOW-3) Where: HIGH - Maximum price of the last bar; HIGH-1, HIGH-2, HIGH-3 - Maximum prices from 1, 2, and 3 periods ago; LOW - Minimum price of the last bar; LOW-1, LOW-2, LOW-3 - Minimum prices from 1, 2, and 3 periods ago. Once you’ve got those moving averages, you can sum them over the last 4 periods, whether that’s hours or days: 2. The second line is simply the 4-period symmetrically weighted moving average of the first line: RVIsignal = (RVIaverage + 2 * RVIaverage-1 + 2 * RVIaverage-2 + RVIaverage-3)/6

2010.01.26
Mastering the Relative Strength Index (RSI) for Better Trading Decisions
MetaTrader5
Mastering the Relative Strength Index (RSI) for Better Trading Decisions

The Relative Strength Index (RSI) is a powerful tool for traders, acting as a price-following oscillator that moves between 0 and 100. When J. Welles Wilder first introduced this indicator, he suggested a 14-day period for RSI calculations. Over the years, shorter and longer periods like the 9-day and 25-day RSI have found their place in many traders' strategies. One of the most effective ways to analyze the RSI is by spotting divergences. This happens when the security reaches a new high while the RSI fails to break its previous peak, signaling a potential reversal. When the RSI starts to decline and dips below its latest low, that's known as a "failure swing" and is often considered a confirmation of the anticipated reversal.Here are some handy ways to leverage the Relative Strength Index in your chart analysis: Tops and Bottoms: Typically, the RSI peaks above 70 and bottoms below 30, often forming these critical points before the underlying price chart. Chart Patterns: The RSI can create chart patterns like head and shoulders or triangles, which may not be as apparent on the price chart itself. Failure Swings: This occurs when the RSI surpasses a previous high or drops below a recent low, signaling potential support or resistance breakouts. Support and Resistance Levels: The RSI often highlights support and resistance levels more clearly than the price action itself. Divergences: As mentioned earlier, divergences happen when the price makes a new high or low that isn't confirmed by the RSI, often leading to price corrections in line with the RSI's direction. Calculation: The formula for calculating the RSI is: RSI = 100 - (100 / (1 + U / D)) where: U: the average of positive price changes; D: the average of negative price changes.

2010.01.26
Understanding the Price Rate of Change (ROC) Indicator for Traders
MetaTrader5
Understanding the Price Rate of Change (ROC) Indicator for Traders

Hey there, fellow traders! If you’ve been in the game for a while, you know that price movements can be a bit like waves—constantly rising and falling. These fluctuations are driven by shifts in investor sentiment and the ongoing battle between bulls and bears in the market. The Price Rate of Change (ROC) indicator acts like an oscillator, capturing this ebb and flow by measuring the price changes over a specific period. When prices rise, the ROC rises; when they fall, so does the ROC. The more significant the price movement, the more pronounced the changes in the ROC. The 12-day and 25-day ROC indicators are particularly popular among traders. The 12-day ROC is a fantastic tool for identifying overbought or oversold conditions in both short-term and medium-term trading scenarios. As a rule of thumb, a higher ROC suggests a stronger likelihood of a price increase. However, as with any overbought or oversold indicators, it’s wise to hold off on jumping into a trade until the market shows a clear direction—either turning up or down. Just because the market looks overbought doesn’t mean it’ll reverse immediately; trends can persist longer than you might expect. Price Rate of Change indicator How to Calculate ROC: To find the speed of price change, you simply take the difference between the current closing price and the closing price from 'n' periods ago. ROC = ((CLOSE (i) - CLOSE (i - n)) / CLOSE (i - n)) * 100 Where: CLOSE (i) - the closing price of the current bar; CLOSE (i - n) - the closing price 'n' bars ago; ROC - the value of the Price Rate of Change indicator.

2010.01.26
Understanding the Price and Volume Trend (PVT) Indicator for MetaTrader 5
MetaTrader5
Understanding the Price and Volume Trend (PVT) Indicator for MetaTrader 5

Hey traders! Today, let's dive into the Price and Volume Trend (PVT) indicator, a handy tool on MetaTrader 5 that helps you analyze price movements in conjunction with trading volume. Similar to the On Balance Volume (OBV) indicator, PVT gives you a cumulative view of trade volumes while factoring in the changes in close prices. The way PVT calculates its values is a bit different from OBV. In OBV, we add the entire daily volume to the indicator when the close price goes up, and subtract it when it goes down. However, PVT takes a more nuanced approach by adding or subtracting only a portion of that daily volume. This portion is determined by how much the current price has changed compared to the previous day's close. While OBV sums up the cumulative total volumes for each period, PVT multiplies the volume by a coefficient based on the price change. This gives you a more responsive indicator that reacts to price movements rather than just volume shifts. Price and Volume Trend indicator How PVT is Calculated: The PVT calculation is straightforward: it takes the current volume and multiplies it by the relative price change, then adds that to the current cumulative PVT value. PVT (i) = ((CLOSE (i) - CLOSE (i - 1)) / CLOSE (i - 1)) * VOLUME (i) + PVT (i - 1) Here’s what each term means: CLOSE (i) - the close price of the current bar; CLOSE (i - 1) - the close price of the previous bar; VOLUME (i) - the volume of the current bar; PVT (i) - the current value of the PVT indicator; PVT (i - 1) - the value of the PVT indicator from the previous bar.

2010.01.26
Mastering the Parabolic SAR Indicator for MetaTrader 5
MetaTrader5
Mastering the Parabolic SAR Indicator for MetaTrader 5

Parabolic SAR is a fantastic tool for traders looking to analyze trending markets. This technical indicator is displayed right on your price chart and acts similarly to a Moving Average. However, what sets the Parabolic SAR apart is its dynamic nature—it's more responsive and can shift its position based on price movements. In an uptrend, you’ll find the Parabolic SAR below the price, while in a downtrend, it moves above the price. When the price crosses the Parabolic SAR lines, the indicator flips, and its new values will be located on the opposite side of the price. This flip signals a potential trend reversal or a period of consolidation. So, when you see this happen, keep your eye out for either a correction or a new trend beginning.The Parabolic SAR is a valuable tool for identifying exit points. For long positions, you’ll want to close out when the price dips below the SAR line, while for short positions, close when the price rises above it. This means you should always be tracking the movement of the Parabolic SAR and only keeping your positions open in the direction it’s moving. Many traders also use this indicator as a trailing stop line. If you’re holding a long position (with the price above the SAR line), the Parabolic SAR line will continue to rise no matter which way the price moves. The distance the SAR line moves is tied to how much the price is fluctuating. Parabolic SAR indicator How to Calculate: For long positions: SAR (i) = SAR (i - 1) + ACCELERATION * (HIGH (i - 1) - SAR (i - 1)) For short positions: SAR (i) = SAR (i - 1) + ACCELERATION * (LOW (i - 1) - SAR (i - 1)) Where: SAR (i - 1) - value of Parabolic SAR on the previous bar; ACCELERATION - acceleration factor; HIGH (i - 1) - maximum price for the previous period; LOW (i - 1) - minimum price for the previous period. The value of the indicator increases when the current price exceeds the previous highs during a bullish trend, and vice versa. The acceleration factor (ACCELERATION) doubles at that time, causing the Parabolic SAR to converge towards the price. In simpler terms, the faster the price moves, the quicker the indicator will catch up.

2010.01.26
Mastering the On Balance Volume (OBV) Indicator for Trading Success
MetaTrader5
Mastering the On Balance Volume (OBV) Indicator for Trading Success

On Balance Volume (OBV) is a popular momentum indicator that connects volume with price changes. Developed by Joseph Granville, it’s straightforward and effective. Here’s how it works: if the close price of the current candle is higher than the previous one, we add the current volume to the OBV. Conversely, if the close price is lower, we subtract the current volume from the OBV. Simple enough, right? The core idea behind OBV analysis is that changes in the OBV often happen before price changes. When you see the OBV rising, it indicates that smart money is flowing into the asset. Eventually, when the general public starts buying in, both the price and the OBV typically surge together. However, if the price moves ahead of the OBV, that’s a signal for concern—this is known as a “non-confirmation.” You might see this at the peaks of bull markets (when prices rise before the OBV) or at the bottoms of bear markets (when prices fall before the OBV). You can tell that OBV is in a rising trend when each new peak and trough is higher than the last. On the flip side, it’s in a downtrend when every peak and trough is lower. If the OBV is just hanging around without making significant highs or lows, it’s in a questionable trend. Once a trend is established, it tends to stick around until something breaks it. There are two ways this can happen: the trend can switch from rising to falling or vice versa. The second way is if it shifts to a sideways trend and remains there for more than three days. For instance, if the OBV flips to a sideways trend for just two days before returning to a rising trend, it’s still considered to be in a rising trend. When the OBV transitions to a rising or falling trend, that’s your breakout moment. Since OBV breakouts usually signal upcoming price breakouts, it’s a good idea to go long on OBV upside breakouts. Conversely, if you see a downside breakout on the OBV, it might be time to short. Hold onto your positions until the trend changes. On Balance Volume indicator Calculation: If the current close price is higher than the previous one, then: OBV (i) = OBV (i - 1) + VOLUME (i) If the current close price is lower than the previous one, then: OBV (i) = OBV (i - 1) - VOLUME (i) If the current close price is equal to the previous one, then: OBV (i) = OBV (i - 1) Where: OBV (i) - value of the On Balance Volume indicator for the current period; OBV (i - 1) - value of the On Balance Volume indicator for the previous period; VOLUME (i) - volume of the current bar.

2010.01.26
Mastering the Momentum Indicator in MetaTrader 5 for Smarter Trading
MetaTrader5
Mastering the Momentum Indicator in MetaTrader 5 for Smarter Trading

The Momentum technical indicator is a powerful tool that measures how much a security’s price has changed over a specific time frame. Traders often use the Momentum indicator in two primary ways: As a trend-following oscillator: Similar to the Moving Average Convergence/Divergence (MACD), you can buy when the indicator hits a low and starts to rise, and sell when it peaks and begins to drop. To help identify these turning points, consider overlaying a short-term moving average of the Momentum indicator itself. If the Momentum indicator spikes to extremely high or low levels compared to its historical values, it usually suggests that the current trend will continue. For instance, if you see the Momentum reaching a peak and then turning down, it’s likely the prices will continue to rise before eventually correcting. However, always wait for price confirmation before making your move (for example, if prices peak and then start to drop, wait for a clear downward trend before selling). As a leading indicator: This approach suggests that market tops are often marked by rapid price increases (when traders are overly optimistic) and bottoms by swift declines (when fear drives traders to exit). While this holds true in many cases, be mindful that it’s a broad generalization. As the market peaks, the Momentum indicator typically climbs sharply before falling off, creating a divergence from continued upward or sideways price movement. Conversely, at market bottoms, Momentum may drop sharply only to begin rising ahead of the price itself. These divergences between the indicator and price can be significant signals. How to Calculate Momentum: Momentum is calculated as a ratio of today’s price to the price from several periods ago. MOMENTUM = CLOSE (i) / CLOSE (i - n) * 100 Where: CLOSE(i): The closing price of the current bar; CLOSE(i-N): The closing price from N periods ago.

2010.01.26
Unlocking the Money Flow Index (MFI) for Successful Trading
MetaTrader5
Unlocking the Money Flow Index (MFI) for Successful Trading

Money Flow Index (MFI) is a vital technical indicator that helps traders gauge the rate at which money flows into and out of a security. Its construction and interpretation are quite similar to the Relative Strength Index (RSI), but with a key difference: volume plays a crucial role in the MFI calculations. When you're digging into the Money Flow Index, keep the following points in mind: Divergences between the MFI and price trends can signal a reversal. For instance, if prices are climbing while the MFI is declining (or the other way around), it’s a strong indicator that a price shift might be on the horizon. Values above 80 suggest a potential market peak, while those below 20 indicate a possible bottom. Image: Money Flow Index indicator How is MFI Calculated? The calculation of the Money Flow Index involves several steps: TP = (HIGH + LOW + CLOSE) / 3 First, you'll determine the typical price (TP) for the period in question. Next, calculate the Money Flow (MF): MF = TP * VOLUME If today’s typical price exceeds yesterday’s TP, we consider the money flow positive. Conversely, if it’s lower, the money flow is negative. Positive Money Flow is the total of positive money flows over a selected period, while Negative Money Flow is the sum of negative flows over that same period. Next up, we calculate the money ratio (MR) by dividing positive money flow by negative money flow: MR = POSITIVE MONEY FLOW / NEGATIVE MONEY FLOW Finally, we can compute the Money Flow Index using the money ratio: MFI = 100 - (100 / (1 + MR)) Here’s what each term means: HIGH: The highest price of the current bar; LOW: The lowest price of the current bar; CLOSE: The closing price of the current bar; VOLUME: The volume of the current bar.

2010.01.26
Unlocking the Market Facilitation Index (BW MFI) for Better Trading Insights
MetaTrader5
Unlocking the Market Facilitation Index (BW MFI) for Better Trading Insights

The Market Facilitation Index (BW MFI) is a powerful technical indicator for MetaTrader 5 that helps traders understand price changes on a tick-by-tick basis. While the absolute values of the MFI might not seem significant on their own, it’s the changes in the indicator that tell the real story. Bill Williams, the creator of this indicator, highlights the relationship between the MFI and trading volume: When MFI goes up and volume increases: This suggests that more traders are entering the market. New players are opening positions in the direction of the bar's movement, indicating that the trend is gaining momentum. When MFI falls and volume falls: This signals a lack of interest from market participants, often leading to stagnant price action. When MFI rises but volume decreases: This indicates that the price movement might not be backed by strong market participation, and could be driven by speculative activity from brokers and dealers. When MFI drops while volume rises: This represents a tug-of-war between buyers and sellers. Even though there's significant buying and selling volume, the price remains relatively stable. This scenario often leads to a breakout where one side gains the upper hand, highlighting a potential trend continuation or reversal, which Bill Williams refers to as a "curtsying" bar. Market Facilitation Index Indicator How to Calculate the MFI: To compute the Market Facilitation Index, you can use the following formula: BW MFI = (HIGH - LOW) / VOLUME Where: HIGH: The maximum price of the current bar. LOW: The minimum price of the current bar. VOLUME: The volume of the current bar.

2010.01.26
Understanding the MACD Indicator for Trading Success
MetaTrader5
Understanding the MACD Indicator for Trading Success

Moving Average Convergence/Divergence (MACD) is a powerful trend-following indicator that helps traders spot potential buying and selling opportunities by examining the relationship between two Moving Averages of a price. The MACD is derived from the difference between the 12-period and 26-period exponential moving averages (EMA). To make it easier to identify buy and sell signals, a signal line, which is a 9-period moving average of the MACD itself, is plotted on the MACD chart.This indicator shines in volatile markets and can be utilized in several ways: through crossovers, identifying overbought/oversold conditions, and spotting divergences. Crossovers: The fundamental MACD strategy is to sell when the MACD dips below the signal line. Conversely, a buy signal occurs when the MACD crosses above its signal line. Many traders also consider buying or selling when the MACD crosses the zero line. Overbought/Oversold Conditions: The MACD is handy for spotting overbought or oversold conditions. If the shorter moving average moves significantly away from the longer moving average (i.e., the MACD rises sharply), it suggests that the security price might be overextended and is likely to revert to more normalized levels. Divergence: A divergence between the MACD and the security price can indicate a potential reversal. A bullish divergence occurs when the MACD makes new highs while prices fail to do the same, signaling a possible upturn. Conversely, a bearish divergence happens when the MACD posts new lows while prices do not, hinting at a potential downturn. These divergences are particularly meaningful when they occur at overbought or oversold levels. MACD Indicator How to Calculate the MACD: To calculate the MACD, subtract the value of the 26-period EMA from the 12-period EMA. Then, a 9-period simple moving average of the MACD (the signal line) is plotted on top of it. MACD = EMA(CLOSE, 12) - EMA(CLOSE, 26)SIGNAL = SMA(MACD, 9) Where: EMA - Exponential Moving Average; SMA - Simple Moving Average; SIGNAL - the indicator's signal line.

2010.01.26
Mastering Ichimoku Kinko Hyo: A Trader's Guide for MetaTrader 5
MetaTrader5
Mastering Ichimoku Kinko Hyo: A Trader's Guide for MetaTrader 5

Ichimoku Kinko Hyo is a powerful technical indicator designed to provide traders with valuable insights into market trends, support and resistance levels, and buy/sell signals. This indicator shines best when applied to weekly and daily charts. It utilizes four different time intervals to define its parameters, with each line of the indicator based on these intervals: Tenkan-sen: This line represents the average price during the first time interval, calculated as the sum of the maximum and minimum prices within that period, divided by two. Kijun-sen: Similar to the Tenkan-sen, this line shows the average price over a second time interval. Senkou Span A: This line is the midpoint between the Tenkan-sen and Kijun-sen, shifted forward by the value of the second time interval. Senkou Span B: This line represents the average price during a third time interval, also shifted forward by the second time interval. The Chikou Span displays the closing price of the current candle, shifted back by the second time interval. The area between the Senkou lines is often shaded and referred to as the “cloud.” When the price is positioned between these lines, the market is typically considered non-trending, with the cloud’s edges serving as support and resistance levels. If the price is above the cloud, the upper line acts as the first support level, while the lower line serves as the second support level. Conversely, if the price is below the cloud, the lower line becomes the first resistance level, and the upper line becomes the second resistance level. When the Chikou Span crosses the price chart from below to above, it signals a potential buy opportunity. If it crosses from above to below, it indicates a potential sell signal. The Kijun-sen is a crucial indicator of market movement. If the price is trading above this line, it suggests that prices are likely to continue rising. A cross below the Kijun-sen may indicate a possible trend reversal. The Kijun-sen also provides trading signals: when the Tenkan-sen crosses above it, that’s a buy signal; crossing below signals a sell. The Tenkan-sen itself indicates market trends: a rising line shows an uptrend, while a falling line indicates a downtrend. A horizontal line suggests that the market may be consolidating. Explore the Ichimoku Kinko Hyo indicator

2010.01.26
Understanding the Gator Oscillator: A Key Indicator for MetaTrader 5
MetaTrader5
Understanding the Gator Oscillator: A Key Indicator for MetaTrader 5

The Gator Oscillator is an essential tool for traders using MetaTrader 5, built on the foundations of the Alligator Indicator. This oscillator effectively highlights the convergence and divergence of the Balance Lines, which are calculated using the Smoothed Moving Average (SMMA). In the Gator Oscillator, the upper bar chart represents the absolute difference between the blue and red lines, while the lower bar chart indicates the difference between the red and green lines, displayed with a negative sign to create a top-down view. Gator Oscillator How It's Calculated: MEDIAN PRICE = (HIGH + LOW) / 2ALLIGATOR'S JAW = SMMA (MEDIAN PRICE, 13, 8)ALLIGATOR'S TEETH = SMMA (MEDIAN PRICE, 8, 5)ALLIGATOR'S LIPS = SMMA (MEDIAN PRICE, 5, 3)Where: MEDIAN PRICE - the average price; HIGH - the highest price of the bar; LOW - the lowest price of the bar; SMMA (A, B, C) - the Smoothed Moving Average. Here, A is the data to be smoothed, B is the smoothing period, and C is the shift into the future. For example, SMMA (MEDIAN PRICE, 5, 3) means that the smoothed moving average is based on the median price, with a smoothing period of 5 bars and a shift of 3 bars; ALLIGATOR'S JAW - the blue line; ALLIGATOR'S TEETH - the red line; ALLIGATOR'S LIPS - the green line. Note: We’ve added two indicator codes for your convenience: Gator.mq5 which calculates the Gator using Moving Averages (iMA), and Gator_2.mq5 which utilizes the iAlligator for its calculations.

2010.01.26
First Previous 339 340 341 342 343 344 345 346 347 348 349 Next Last