Technical Indicator

Unlock Trading Insights with Jays Candle Display for MetaTrader 4
MetaTrader4
Unlock Trading Insights with Jays Candle Display for MetaTrader 4

Author:Oje Uadia Introduction to Jays Candle Display If you’re looking to enhance your trading analysis, the Jays Candle Display indicator for MetaTrader 4 is a game-changer. This nifty tool lets you visualize multiple candles across various timeframes, from one minute to one day, all in one place. When you’re scanning the charts, bear candles will pop up in red, while bull candles will shine in green. It’s a simple yet effective way to get the lay of the land at a glance. Customizing Your Candle Observations By default, this indicator showcases the current candle, but you can easily tweak it to view previous candles. Want to check out the last candle? Just adjust the candle shift to 1. If you're curious about the candle two steps back, set the shift to 2. It’s as easy as pie! This feature is particularly advantageous for traders who love to dive deep into statistics. It allows you to quickly grasp the movements of selected candles without getting lost in the numbers. Understanding Candle Metrics Jays Candle Display features two essential columns: Body and Swing. Body: This column reveals how many pips the candle moved from open to close. Essentially, it tells you how many pips you could’ve pocketed if you jumped in at the open and held until the close. Swing: This metric shows the total movement of the candle, calculated by subtracting the low from the high of each displayed candle. With the Jays Candle Display, you’ll have a clearer picture of market movements, helping you make more informed trading decisions. Give it a try and see how it can elevate your trading game!

2009.12.07
Mastering the Elliott Waves Indicator for MetaTrader 4
MetaTrader4
Mastering the Elliott Waves Indicator for MetaTrader 4

Author: Vladimir Hlystov The Elliott Waves Indicator doesn’t draw the waves for you, but it’s an essential tool for identifying them. Let’s dive into how it works: Understanding the Elliott Waves 1. The WAVE. First things first, you’ll need to draw a trend line using Fractals and label it in this format: "1 *****". For example: 1 wave. After the first tick (or if you’re eager, just right-click to update), you should see something like this: The dotted line with the rectangle indicates the expected price movement. If you’ve defined the wave correctly, the price should hit that estimated rectangle. Here, V represents the average volume in the first wave. Next, we wait for the lower fractal and rename the dotted line to 2 wave (make sure to keep that number and space!). Now, drag the end of that line to the next formed lower fractal, and you’ll get the estimated price movement for the 3rd wave: If you try to move the line to a bar without a fractal, the indicator will notify you and attempt to adjust the line based on its calculations. If it doesn’t move the line, you’ll need to do it manually. Once the price reaches the rectangle (in this case, the price moved higher than expected), rename the dotted line to 3 wave and shift it to the upper fractal. Here’s how it looks: Keep in mind, the average volume in the 3rd wave is always greater than in the 1st wave. This suggests that our wave definition might not be spot on. Regardless, we’ve hit our target, and we can keep going! After the price reaches the estimated target and the next fractal forms, rename the dotted line to 4 wave and adjust the end to the fractal: Next, wait for the upper fractal at the estimated target and draw the "a b c" retracement. For more details, check out Bill Williams' book, "Trade Chaos." Recommendations The "Fractals.mq4" indicator (attached here) is great for drawing the initial line. Avoid placing orders right after the fractal; it’s wiser to wait for the price to move in the expected direction. Sure, this might mean smaller profits, but the risk stays the same. I recommend setting a Stop Loss as advised by Bill Williams. Final Thoughts Note: This is a localized version of the original Russian article. If you have any questions for the author, suggestions, or comments, it’s best to post them here. If you find this code helpful for trading or educational purposes, don’t forget to give a shout-out to the author!

2009.12.05
Enhance Your Trading with the Noise-Reduced Stochastic Indicator for MetaTrader 4
MetaTrader4
Enhance Your Trading with the Noise-Reduced Stochastic Indicator for MetaTrader 4

Description: Introducing the Noise-Reduced Stochastic Oscillator! This innovative indicator builds on the standard Stochastic Oscillator, but with a twist. It features an added sensitivity parameter (Sens) to help filter out the noise in your trading signals. Like the standard Stochastic, this version maintains the same parameters, yet it allows you to focus on oscillations that fall below a predefined threshold, measured in points. This means fewer false signals, which is always a win for traders! Traditionally, the Lane Stochastic places the current price between the highest and lowest prices defined by the %K (Kperiod) value without distinguishing between extreme points, whether they are 1 point or 100 points apart. In both scenarios, you'll end up with similar overbought/oversold signals. By incorporating a threshold, you can now focus on only the significant price movements. 
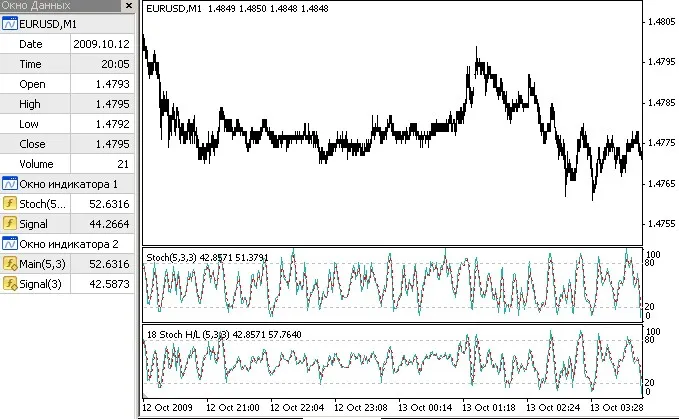
Check out Fig. 1 below, where you can see the price chart for EURUSD on a 1-minute timeframe along with the standard Stochastic and the Noise-Reduced Stochastic indicator in action. Image: Fig 1. The indicator fields mirror those of the iStochastic, but remember, we’re adding that extra Sens parameter. The output buffers are consistent: 0 is for the Stochastic value itself, while 1 is for the signal line. double iCustom(string symbol, int timeframe, "_StochNR", int %Kperiod, int %Dperiod, int slowing, int method, int price_field, int mode, int shift); // StochNR added new Sens field double iStochastic(string symbol, int timeframe, int %Kperiod, int %Dperiod, int slowing, int method, int price_field, int mode, int shift) // standard stochastic For practical implementation, you can call it as described, but a smoother approach would be to integrate some code into your Stoch function: double Stoch(int Kperiod, int Slowing, int PriceField, double sens, int i) {      // maximum and minimum prices    double max,min,c;    for(int j=i; j<i+Slowing; j++) {       if(PriceField==1) { // based on Close          max+=Close[ArrayMaximum(Close,Kperiod,j)];          min+=Close[ArrayMinimum(Close,Kperiod,j)];         }       else { // based on High/Low          max+=High[ArrayMaximum(High,Kperiod,j)];          min+=Low[ArrayMinimum(Low,Kperiod,j)];         }       c+=Close[j];      }       double delta=max-min;    if(delta<sens) {       sens/=2;       max+=sens; min-=sens;      }    delta=max-min;    if(delta==0) double s0=1;    else s0=(c-min)/delta;    return(100*s0);   } As you can see, if you're looking to generate a signal line, you'll need an additional moving average of its values. Alternatively, you can extract it from the iCustom's first buffer, but that may slow things down. With this updated naming convention, it's clear that the price calculation type is incorporated. If the sensitivity is set above zero, this value will also appear in the oscillator's name. Editor's Note: This content is a direct adaptation of the original Russian version. If you have any questions for the author or would like to share your thoughts, feel free to drop them here. If you find this code helpful for your trading or educational needs, don’t forget to show some appreciation for the author!

2009.11.23
Mastering the SAR Oscillator: A Guide for MetaTrader 4 Users
MetaTrader4
Mastering the SAR Oscillator: A Guide for MetaTrader 4 Users

Author: Damien Understanding the Parabolic SAR Hey there, fellow traders! If you’re looking to add a powerful tool to your trading arsenal, the Parabolic SAR (Stop and Reverse) oscillator is worth considering. It’s a trend-following indicator that can help you identify potential reversals in the market. Let’s dive into how this tool works and how you can effectively incorporate it into your trading strategy. What is the Parabolic SAR? The Parabolic SAR is designed to provide you with the potential exit and entry points in a trending market. It appears as dots on your chart, either above or below the price action, indicating the direction of the trend: Dots below the price: This signals a bullish trend, suggesting it might be a good time to buy. Dots above the price: This indicates a bearish trend, suggesting a potential sell opportunity. How to Use the Parabolic SAR in MetaTrader 4 To leverage this indicator effectively in MetaTrader 4, follow these simple steps: Open your MT4 platform and navigate to the Insert menu. Select Indicators, then Trend, and choose Parabolic SAR. Adjust the settings according to your trading style, whether you prefer a more sensitive or smoother indicator. Remember, the Parabolic SAR works best in trending markets and can sometimes lead to false signals in sideways markets. Always consider using it in conjunction with other indicators or analysis methods for the best results. Final Thoughts Incorporating the Parabolic SAR into your trading strategy can give you an edge in identifying market trends. Just keep in mind that, like any tool, it’s most effective when used as part of a comprehensive trading plan. Happy trading!

2009.11.23
Unlocking Insights with the Open Interest Online Indicator for MetaTrader 4
MetaTrader4
Unlocking Insights with the Open Interest Online Indicator for MetaTrader 4

Description: Hey fellow traders! I’m excited to introduce you to the latest version of the Open Interest Online Indicator. This revamped tool comes with an intuitive design that makes tracking market sentiment easier than ever. Here’s a quick rundown of the standout features: Automatic Background and Color Scheme: The indicator now automatically adjusts its background and colors to enhance your trading experience. Proximity Levels: You can now display levels and their values that are closest to the current price, including all 15 strikes. Customizable Brightness: Adjust the brightness of the levels or choose to show only the background for a cleaner look. Open Interest Values: You have the option to view numerical values of Open Interest by Call/Put. Historical Levels: Historical levels can be displayed as an optional feature. When the Open Interest Put values surpass the Open Interest Call values, the indicator turns red, indicating a short position. Conversely, if Call values are greater than Put, the indicator displays blue, signaling a long position. The depth of the colors corresponds to the quantitative ratio of Open Interest against its maximum level for that day, making it easier to visualize the strength of each level. The numerical values relate directly to the Call/Put ratios, giving you actionable insights at a glance. Image: Editor's Note: This is an English adaptation of the original Russian version.

2009.11.17
Spread Monitoring: Enhance Your Trading with this MetaTrader 4 Indicator
MetaTrader4
Spread Monitoring: Enhance Your Trading with this MetaTrader 4 Indicator

Description: The Spread Monitoring indicator is a handy tool that displays a histogram to visualize spread values. It categorizes spreads into minimal (red), average (green), and maximal (blue) on corresponding bars. This monitoring is incredibly beneficial for comparing broker spreads and analyzing spread dynamics over time. Image: Fig 1. Indicator functionality with real and synthetic currency pairs. Broker X. The great thing is that the data collected by the indicator isn't lost after you remove it; you can simply reattach it to the chart to view your historical data. Additionally, this indicator can visualize spreads for synthetic currency pairs. Fig 2. Indicator functionality with real and synthetic currency pairs. Broker Y. Recommendations: To effectively use synthetic currency pairs, follow these steps: Run the attached EXP_Monitoring-Synthetic expert on a real pair (to serve as synthetics). Ensure to specify the currency (Currency property) for the synthetic pair calculation; Open the offline chart for the constructed (XXXYYY_ZZZ) synthetic pair (the chart updates automatically with any new bar); Attach the IND_Monitoring-Spread indicator to the opened offline chart; In the figures above, you'll see synthetic pairs like EURCAD (calculated through USD, using EURUSD and USDCAD) and GBPJPY (calculated through EUR, using EURGBP and EURJPY). For each of these pairs, the IND_Monitoring-Spread indicator illustrates the spread dynamics of the corresponding synthetic pair. You can even use these synthetic pairs in the Strategy Tester as if they were real, which allows you to leverage generated historical data and spread characteristics for future trading. The EXP_Monitoring-Synthetic is a loopback-type expert, meaning it can run as a script (it automatically removes from the chart when you close the terminal). Just like the indicator, this expert retains the historical data of synthetic pairs. The proposed code can be adjusted for real-time updates of the offline chart, though it would demand more computing resources than the current version, which only updates with new bars. Remember to enable DLL use in your client terminal for auto-updating offline charts. Editor's Note: Please note that this is a mirror translation of the original Russian version. If you have any questions for the author, suggestions, or comments, it's best to post them there. If you find this code useful for trading or educational purposes, don't forget to thank the author!

2009.11.12
Maximize Your Trading Insights with the Informer Indicator for MetaTrader 4
MetaTrader4
Maximize Your Trading Insights with the Informer Indicator for MetaTrader 4

Introduction to the Informer Indicator Discover an essential tool for your MetaTrader 4 platform. The Informer Indicator provides a clear view of your closed trades and current account stats right on your chart. This handy indicator displays real-time account statistics, using green labels for long positions, red for short positions, and gray for closed trades. It also draws lines connecting the opening and closing points of trades, with colors indicating the outcome—green for profits and red for losses. I find it incredibly useful for generating trade reports and conducting thorough analyses, as it presents trade results in an easily digestible format. The code is well-commented, making it straightforward to understand and customize. When you remove the indicator from the chart, it automatically cleans up all the objects it created, keeping your workspace tidy. Indicator Parameters The Informer Indicator comes with several customizable parameters: DealMarkers: True; // Show deals DepoStats: True; // Show statistics clAccName: Silver; // Color for account name clInfData: Gray; // Color for account information FontSize: 8; // Font size LeadingSpace: 9; // Spacing for alignment clLineProfit: Lime; // Color for profitable trades clLineLoss: Red; // Color for losing trades clMarkerBuy: Lime; // Color for buy labels clMarkerSell: Red; // Color for sell labels clMarkerClose: Silver; // Color for close labels Special thanks to KimIV and xrust for their contributions! Editor's Note Keep in mind that this is a mirror version of the original Russian version. If you have questions, suggestions, or comments for the author, the best place to share them is there. If you find this code helpful for your trading or educational purposes, a shout-out to the author would be appreciated! ============================================================================================================================================= Version Updates Version #4 Fixed "zero divide" error Added Magic filter Added labels for open positions Included TP & SL levels Language switcher When you remove the indicator, it will also delete all objects it created, keeping your chart organized. All Parameters Lang_Eng: True; // English or Russian DealMarkers: True; // Show deals DepoStats: True; // Show statistics ShowLive: True; // Show price markers for open trades MagicFilter: ""; // Comma-separated Magic Numbers to filter trades clAccName: Silver; // Color for account name clInfData: Gray; // Color for account information FontSize: 8; // Font size DigitsLength: 9; // Length of digits for alignment PercentLength: 5; // Length of percentage for alignment clLineProfit: Lime; // Color for profitable trades clLineLoss: Red; // Color for losing trades clMarkerBuy: Lime; // Color for buy labels clMarkerSell: Red; // Color for sell labels clMarkerClose: Silver; // Color for close labels With ShowLive = True, you can see TP & SL levels on your chart. One order successfully closed by TP. Recommendations In Account History, select All History. If using ShowLive = True, turn off trade levels (Tools > Options > Charts > [ ] Show trade levels).

2009.11.11
Calculate Stop Loss Levels Using Bill Williams' Technique in MetaTrader 4
MetaTrader4
Calculate Stop Loss Levels Using Bill Williams' Technique in MetaTrader 4

Author Vladmir Hlystov Calculate Stop Loss Levels with Bill Williams' Technique In his book, "Trading Chaos: Applying Expert Techniques to Maximize Your Profits" (Chapter 7, Level One: Novice Trader, p.95), Bill Williams vividly describes Stop Loss (SL) placement: "...We place the airbag one tick above or below the high or low of the second bar back on a significantly higher time frame (or the next bar back that has both a higher high and a higher low or a lower high and lower low). This is our airbag protection, safeguarding us against a volatile market that moves against our position. Remember, it's not necessarily an entry signal; it’s a shield against substantial losses..." This indicator calculates and displays Stop Loss levels for Buy and Sell positions that don’t have an SL set, following this strategy. Indicator Variables: int BAR = 200; // searching within the last 200 barsint minSL = 25; // activated when 2 bars are not foundbool show_bar = true; // display bars searched for SLbool show_info = true; // show active orders without SLcolor color_BAR = DarkSlateGray; // color of the bar where SL is searchedcolor color_Curr_BAR = Gray; // color of the current barcolor color_SL = Gray; // color of the SL markers Fig 1. Bar Found for SL Calculation Fig 2. Upper Bar Not Found (SL for Sell Position Determined Using Higher Timeframe) Recommendations: Set your chart shift to display the SL level on the right side of the current bar: To enhance visibility, set show_bar=true. Good luck and happy trading! Update: 17.10.2009A new feature has been added: You can now display Stop Loss Levels in historical data (SL_BW.mq4):

2009.11.10
First Previous 342 343 344 345 346 347 348 349 350 351 352 Next Last