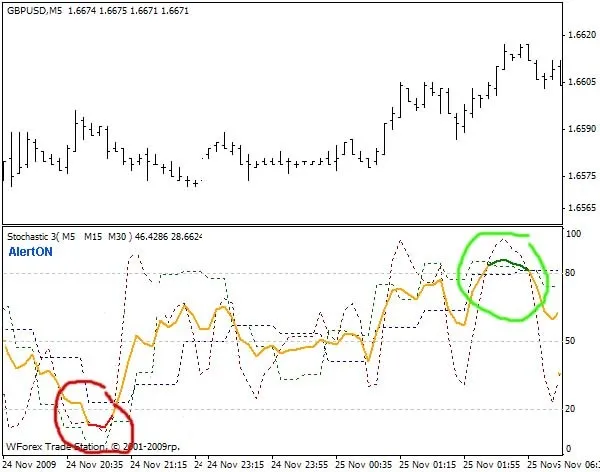
When I first started trading, my strategy revolved around buying when the Stochastic indicators dipped below 20 and selling when they climbed above 80. It was a solid approach, but constantly switching timeframes became a hassle.
To streamline my trading experience, I decided to create this handy indicator. I believe it could be a game-changer for you too!
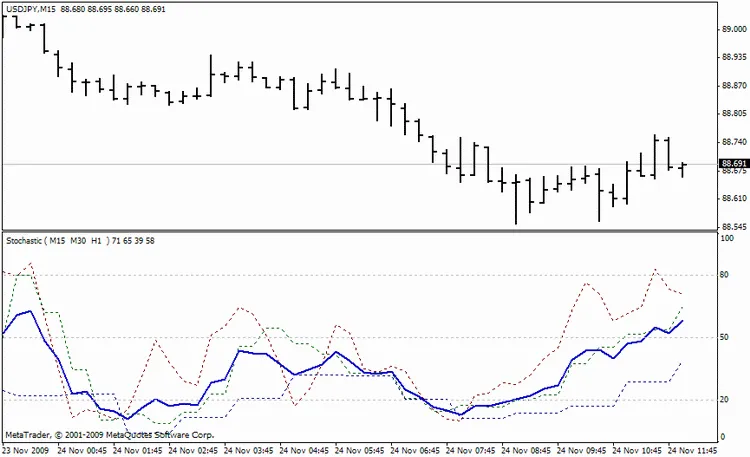
This indicator displays Stochastic values for multiple timeframes all on one chart, and it also calculates the average value represented by the blue line on the chart.
Check it out:
If you're interested in more of my trading solutions, feel free to visit my publications here: https://www.mql5.com/ru/users/cmillion/publications. Wishing you the best of luck!
Editor's note:
Just a heads-up, this content is a localized version of the original Russian article.
If you have any questions for the author or comments, it’s best to post them here.
If you find this code helpful for your trading or learning journey, don't forget to show your appreciation to the author!
-------------------------------------------------------------------------------------------------------------------------
Stochastic3_v2.mq4
Good luck and happy trading!
Related Posts
- Unlocking MetaCOT 2: Your Ultimate CFTC Indicator Toolkit for MT4
- Unlocking the Power of Master Tools for MetaTrader 4
- Visualize Current Trends Across All Time Frames with This MetaTrader 4 Indicator
- Unlock Trading Insights with Volume Profile + Range v6.0 for MetaTrader 5
- Mastering Trading with the MultiLineMovingAverage Indicator for MetaTrader 5