The Jay Digital Parabolic Spy is your go-to multi-timeframe indicator based on the Parabolic SAR.
This nifty tool provides insights across various timeframes, ranging from 15 minutes all the way up to 4 hours.
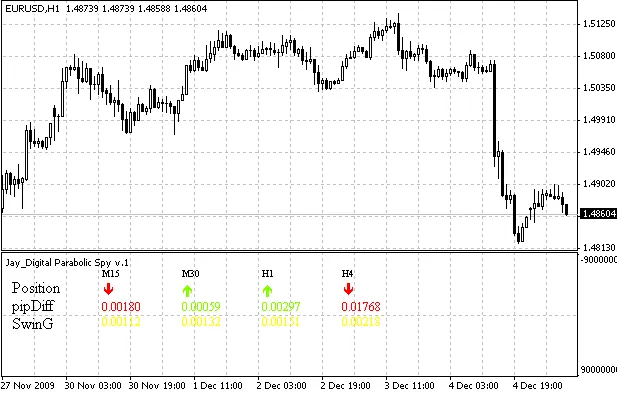
When the Parabolic SAR sits below the price, signaling a potential buy, you’ll see a green arrow pointing upwards. On the flip side, if it’s above the price, a red arrow pointing downwards will pop up, indicating a sell signal.
The indicator showcases three key values: Position, Pip Difference, and Swing.
Position tells you the current direction of the Parabolic SAR. A green arrow means it’s time to buy, while a red arrow indicates a sell.
Pip Difference reveals how far the price is from the Parabolic SAR in pips. Simply put, it shows how many pips the Parabolic SAR would need to move in the opposite direction before a signal reversal occurs.
Swing measures the entire length of the candle in pips, giving you an idea of price volatility.
Keep in mind that all these values pertain to the current candles on their respective timeframes.
Check out the Indicator in Action:
Related Posts
- Unlocking the Power of Master Tools for MetaTrader 4
- Unlock Trading Insights with Volume Profile + Range v6.0 for MetaTrader 5
- Visualize Current Trends Across All Time Frames with This MetaTrader 4 Indicator
- Unlocking MetaCOT 2: Your Ultimate CFTC Indicator Toolkit for MT4
- How to Use the Change Chart Symbol Menu for MetaTrader 4