Technical Indicator

Mastering the Force Index (FRC) for Smart Trading on MetaTrader 5
MetaTrader5
Mastering the Force Index (FRC) for Smart Trading on MetaTrader 5

Force Index is a powerful technical indicator created by Alexander Elder that every trader should consider adding to their toolkit. This index measures the strength of the market by evaluating the Bulls Power during price increases and the Bears Power during price declines. By linking price trends, drops, and trading volumes, the Force Index provides insights that can help you make informed trading decisions. While you can use the Force Index on its own, combining it with a Moving Average can enhance its effectiveness. For optimal results, apply a short moving average (the recommendation is to use 2 periods), which helps pinpoint the best moments to open and close trades. If you're using a longer moving average (like a 13-period), it can help identify overall trends and their shifts. Buy signals typically arise when the Force Index dips below zero during an upward trend. The index indicates a continuation of the bullish trend when it reaches a new peak. Look for sell signals when the index turns positive in a downward trend. When the index drops to a new low, it signals the Bears' Power and the ongoing bearish trend. If you see price changes that don’t match up with volume changes, the Force Index will stabilize, suggesting that a trend reversal could be on the horizon. Force Index Indicator How to Calculate the Force Index: The Force Index measures market movements based on direction, magnitude, and volume. If the closing price of the current bar exceeds that of the previous bar, the force is positive. Conversely, if it’s lower, the force is negative. The greater the price difference, the stronger the force. Similarly, higher trading volumes amplify the force. FORCE INDEX (i) = VOLUME (i) * ((MA (ApPRICE, N, i) - MA (ApPRICE, N, i-1)) Where: FORCE INDEX (i) - The Force Index of the current bar; VOLUME (i) - The volume of the current bar; MA (ApPRICE, N, i) - Any Moving Average of the current bar for N periods: Simple, Exponential, Weighted, or Smoothed; ApPRICE - Applied price; N - Averaging period; MA (ApPRICE, N, i-1) - Any Moving Average of the previous bar.

2010.01.26
Mastering the Detrended Price Oscillator (DPO) for Effective Trading
MetaTrader5
Mastering the Detrended Price Oscillator (DPO) for Effective Trading

The Detrended Price Oscillator (DPO) is an invaluable tool for traders looking to cut through the noise of price movements. By eliminating the effects of long-term trends, the DPO helps you pinpoint cycles and identify overbought or oversold conditions with ease. Long-term cycles are often made up of several shorter cycles. By analyzing these shorter components, you can uncover critical moments in the cycle's progression. The beauty of the DPO lies in its ability to filter out the influence of long-term cycles on price action. To calculate the DPO, you’ll want to select a specific period, removing cycles longer than that period from the price dynamics while keeping the shorter ones. For optimal results, we recommend a period of 21 or less, using half the cycle's length for smoothing. The overbought and oversold levels are derived from previous price behavior. A solid strategy is to enter a long position when the DPO dips below the oversold level and then crosses back above it. Similarly, if the DPO crosses the zero line from above and then rises, it’s a strong signal to consider a long position. The opposite holds true for short positions—keep an eye on those signals! Detrended Price Oscillator Calculation: DPO = CLOSE - SMA (CLOSE, (N / 2 + 1)) where: SMA - simple moving average; CLOSE - the closing price; N - the cycle period (for instance, if N equals 12, then DPO aligns with the DiNapoli Detrend Oscillator).

2010.01.26
Understanding the DeMarker Indicator for MetaTrader 5: Your Guide to Trading Insights
MetaTrader5
Understanding the DeMarker Indicator for MetaTrader 5: Your Guide to Trading Insights

The DeMarker indicator (DeM) is a powerful technical tool that traders use to gauge market conditions. It works by comparing the highest price of the current period with that of the previous period. Here’s the gist: if the current period's maximum price is higher than the last, we note the difference. If it’s lower or the same, we record a zero. Over a set number of periods, these differences are totaled up. This total becomes the numerator in our DeMarker calculation, which is then divided by the same total plus the differences between the highest prices of the current and previous periods. If the current low is higher than the last low, we again note a zero. When the DeMarker dips below 30, it could signal a potential bullish reversal. Conversely, if it climbs above 70, you might want to brace for a bearish reversal. Keep these thresholds in mind as you analyze the market! For those of you looking at longer timeframes, using this indicator can help you identify broader market trends. On the flip side, shorter periods can give you insights into entry points with minimized risk, allowing you to time your trades in line with the prevailing trend. The DeMarker Indicator in Action How to Calculate the DeMarker Indicator: To calculate the DeMarker for a specific interval (let's call it 'i'), follow these steps: First, we determine DeMax (i): If HIGH (i) > HIGH (i - 1), then: DeMax (i) = HIGH (i) - HIGH (i - 1)Otherwise, DeMax (i) = 0 Next, we find DeMin (i): If LOW (i) < LOW (i - 1), then: DeMin (i) = LOW (i - 1) - LOW (i)Otherwise, DeMin (i) = 0 Then, we calculate the DeMarker value like this: DMark (i) = SMA (DeMax, N) / (SMA (DeMax, N) + SMA (DeMin, N)) Where: HIGH (i) - the highest price of the current bar; LOW (i) - the lowest price of the current bar; HIGH (i - 1) - the highest price of the previous bar; LOW (i - 1) - the lowest price of the previous bar; SMA - Simple Moving Average; N - the number of bars used for the calculation.

2010.01.26
Understanding the Chaikin Volatility Indicator for Better Trading Decisions
MetaTrader5
Understanding the Chaikin Volatility Indicator for Better Trading Decisions

The Chaikin Volatility Indicator is a handy tool for traders, measuring the spread between the highest and lowest prices over a specific timeframe. What sets it apart from other indicators, like the Average True Range (ATR), is that it doesn’t consider price gaps. Instead, it focuses solely on the amplitude between the high and low prices. According to Chaikin’s perspective, a surge in the volume indicator over a short period suggests that prices are nearing their lows—think of it as panic selling. Conversely, a decline in volatility over a longer stretch typically indicates that prices are peaking, which can often happen in a mature bull market. To enhance your trading strategy with the Chaikin Volatility Indicator, it’s wise to use Moving Averages and Envelopes for confirmation of its signals. A peak in the indicator often occurs when market prices retreat from a recent high and the market flattens out. A flat market indicates low volatility, and breaking out of this sideways movement usually doesn’t come with a significant increase in volatility. As prices break above previous highs, you can expect volatility to rise. The Chaikin indicator will continue to climb until a new price peak is established. If you see a rapid drop in volatility, it could signal that the movement is slowing down, hinting at a potential reversal. Chaikin Volatility Indicator Calculation: H-L (i) = HIGH (i) - LOW (i)H-L (i - 10) = HIGH (i - 10) - LOW (i - 10)CHV = (EMA (H-L (i), 10) - EMA (H-L (i - 10), 10)) / EMA (H-L (i - 10), 10) * 100 Where: HIGH (i) - maximum price of the current bar; LOW (i) - minimum price of the current bar; HIGH (i - 10) - maximum price of the bar ten positions back; LOW (i - 10) - minimum price of the bar ten positions back; H-L (i) - difference between the maximum and minimum price in the current bar; H-L (i - 10) - difference between the maximum and minimum price ten bars ago; EMA - exponential moving average.

2010.01.26
Mastering the Chaikin Oscillator: A Key Indicator for Traders
MetaTrader5
Mastering the Chaikin Oscillator: A Key Indicator for Traders

The Chaikin Oscillator (CHO) is a powerful tool that traders can use to gauge market momentum. It's based on the difference between moving averages of the Accumulation/Distribution indicator, giving you insights into market strength. This oscillator operates on three main principles: First: If a stock or index closes higher than its average price for the day (which you can find by calculating the average as [max + min] / 2), it indicates a day of accumulation. The closer the closing price is to the maximum for the day, the more aggressive the accumulation is. Conversely, if the closing price is below the average, it suggests distribution is taking place, with increased activity as the price approaches the day's low. Second: A steady rise in price should be accompanied by an increase in trading volume. Think of volume as the fuel that drives the market's growth. If prices rise but volume lags, it signals weakness—like trying to drive a car without enough gas. On the flip side, a price drop usually happens with low volume, often leading to panic selling by institutional investors. Thus, we typically see a volume increase before a price drop, followed by reduced volume and some accumulation when the market stabilizes. Third: The Chaikin Oscillator helps track the flow of money into and out of the market. By comparing volume dynamics with price movements, you can identify market peaks and troughs over both short and medium-term periods. While there's no surefire method for technical analysis, it’s wise to use the Chaikin Oscillator alongside other indicators. This combo can enhance the reliability of your short- to medium-term trading signals. For instance, pairing it with Envelopes based on a 21-day moving average and an overbought/oversold indicator can yield better results. The most critical signals occur when prices hit maximum or minimum levels—especially at overbought/oversold points—yet the Chaikin Oscillator fails to exceed its previous extremes, indicating a potential reversal. Signals that align with the medium-term trend are generally more trustworthy than those that go against it. Just because the oscillator confirms a new high or low doesn’t guarantee that prices will continue in that direction. I consider this occurrence fairly insignificant. Another way to utilize the Chaikin Oscillator is by watching for changes in its direction as signals for buying or selling, provided these align with the overall price trend. For example, if a stock is on the rise and trading above its 90-day moving average, an upward turn of the oscillator in negative territory could be a buy signal (remember, the stock price needs to stay above that 90-day average). On the other hand, if the oscillator turns down while above zero, that could signal a selling opportunity—again, just make sure the stock price is below the 90-day moving average. Chaikin Oscillator Calculation: To calculate the Chaikin Oscillator, you'll subtract a 10-period exponential moving average of the Accumulation/Distribution indicator from a 3-period exponential moving average of the same indicator. CHO = EMA (A/D, 3) - EMA (A/D, 10) Where: EMA - exponential moving average; A/D - value of the Accumulation/Distribution indicator.

2010.01.26
Understanding the Commodity Channel Index (CCI) for Trading Success
MetaTrader5
Understanding the Commodity Channel Index (CCI) for Trading Success

The Commodity Channel Index (CCI) is a versatile technical indicator that traders use to gauge how far a commodity's price deviates from its average price over a specific period. It’s not just for commodities; you can apply the CCI to any financial instrument to spot potential trading opportunities. When the CCI shows high values, it indicates that the price is significantly above its average, suggesting a potential pullback. Conversely, low CCI values suggest that the price is below its average, hinting that it might be time to find some bargains. Here are two common strategies for using the CCI: Divergence Detection: A classic divergence occurs when the price hits a new high, but the CCI fails to reach a new high. This often precedes a price correction as the market adjusts. Identifying Overbought and Oversold Conditions: The CCI typically fluctuates between ±100. Readings above +100 indicate overbought conditions, suggesting a correction might be on the horizon. On the flip side, readings below -100 signal oversold conditions, which could mean a price rebound is likely. Commodity Channel Index Indicator How to Calculate the CCI: 1. **Determine the Typical Price (TP)**: Add the HIGH, LOW, and CLOSE prices of each bar, then divide by 3: TP = (HIGH + LOW + CLOSE) / 3 2. **Calculate the n-period Simple Moving Average (SMA)** of the Typical Prices: SMA (TP, N) = SUM (TP, N) / N 3. **Subtract the SMA from the Typical Prices** of each of the preceding n periods: D = TP - SMA (TP, N) 4. **Calculate the n-period SMA of absolute D values**: SMA (D, N) = SUM (D, N) / N 5. **Multiply the SMA of D values by 0.015**: M = SMA (D, N) * 0.015 6. **Finally, divide M by D** to get the CCI: CCI = M / D Where: HIGH - maximum bar price; LOW - minimum bar price; CLOSE - closing price; SMA - Simple Moving Average; SUM - sum of values; N - number of periods used for calculation.

2010.01.26
Understanding Bears Power: A Key Indicator for MetaTrader 5
MetaTrader5
Understanding Bears Power: A Key Indicator for MetaTrader 5

When it comes to trading, it's all about the tug-of-war between buyers, or 'Bulls,' pushing prices higher, and sellers, or 'Bears,' driving prices down. The outcome of this daily battle determines whether we see a price increase or decrease compared to the previous day. By examining key metrics, like the highest and lowest prices, we can get a sense of how the day's skirmish unfolded. One crucial aspect to keep an eye on is the balance of Bears Power. Changes in this balance can signal potential trend reversals, which is where the Bears Power oscillator, crafted by Alexander Elder, comes into play. You can find more about it in his book, "Trading for a Living: Psychology, Trading Tactics, Money Management". Elder's oscillator is based on two key premises: The moving average reflects the price equilibrium between buyers and sellers over a certain period. The lowest price during the day indicates the peak power of sellers. Using these foundations, Elder developed the Bears Power indicator, calculated as the difference between the lowest price and the 13-period exponential moving average (LOW - EMA). How to Use Bears Power:For best results, pair this indicator with a trend indicator, typically a Moving Average. Here’s how to interpret it: If the trend indicator is pointing upwards and the Bears Power index is below zero but increasing, consider it a buy signal. Ideally, look for divergence forming in the indicator chart during this setup. Calculation:The first step in calculating this indicator is to determine the exponential moving average, with the 13-period EMA generally being recommended. BEARS = LOW - EMA Where: BEARS - Bears' Power; LOW - The lowest price of the current bar; EMA - Exponential Moving Average. During a downtrend, the LOW will be below the EMA, resulting in a Bears Power reading below zero and a histogram positioned under the zero line. Conversely, if the LOW surpasses the EMA during a price rally, the Bears Power turns positive, and the histogram climbs above the zero line.

2010.01.26
Mastering Bollinger Bands: A Trader's Guide to MetaTrader 5
MetaTrader5
Mastering Bollinger Bands: A Trader's Guide to MetaTrader 5

Bollinger Bands® are a popular technical indicator that many traders swear by. If you're using MetaTrader 5, you might find these bands particularly useful for gauging market volatility. Unlike Envelopes, which are set at a fixed distance from a moving average, Bollinger Bands adjust dynamically based on standard deviations from that average. This means they can widen or contract depending on market conditions, giving you a clear visual cue about volatility. Typically plotted over your price chart, Bollinger Bands can also be added to your indicator chart. The key takeaway here is that prices generally hover between the upper and lower bands. One of the standout features of Bollinger Bands is their variable width: when the market is hot and prices are fluctuating wildly, the bands widen. Conversely, during quieter times, they tighten up, keeping prices within a narrower range. Here are some essential traits of Bollinger Bands that every trader should keep in mind: Sudden price changes often occur after the bands have contracted, indicating a potential breakout. If prices breach the upper band, you might expect the current trend to continue. Conversely, if you see peaks and troughs breaking through the bands followed by movements within the bands, a trend reversal could be on the horizon. Typically, a price movement that starts at one band line tends to reach the opposite band. This last observation can be incredibly helpful for predicting potential price targets. Bollinger Band Indicator How to Calculate Bollinger Bands: Bollinger Bands consist of three lines: the middle line (ML), which is a standard Moving Average. Here's how to calculate it: ML = SUM (CLOSE, N) / N = SMA (CLOSE, N) The upper band (TL) is positioned a set number of standard deviations (D) above the middle line: TL = ML + (D * StdDev) The lower band (BL) is simply the middle line minus the same number of standard deviations: BL = ML - (D * StdDev)Where: SUM (..., N) - the sum over N periods; CLOSE - the closing price; N - the number of periods used in the calculation; SMA - Simple Moving Average; SQRT - square root; StdDev - standard deviation: StdDev = SQRT (SUM ((CLOSE — SMA (CLOSE, N))^2, N)/N) For best results, many traders use a 20-period Simple Moving Average as the middle line, placing the upper and lower bands two standard deviations away. Keep in mind that using moving averages shorter than 10 periods might not yield significant insights.

2010.01.26
Understanding the Alligator Indicator for MetaTrader 5
MetaTrader5
Understanding the Alligator Indicator for MetaTrader 5

The Alligator Indicator is a unique technical tool that combines Balance Lines (or Moving Averages) using fractal geometry and nonlinear dynamics. If you’re looking to dive deeper into this concept, check out B. Williams' book: "New Trading Dimensions: How to Profit from Chaos in Stocks, Bonds and Commodities". Key Components of the Alligator Indicator 
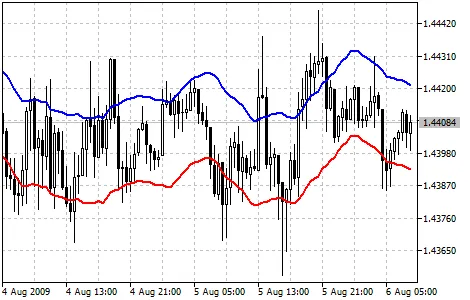
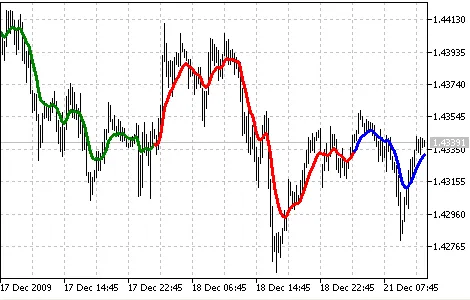
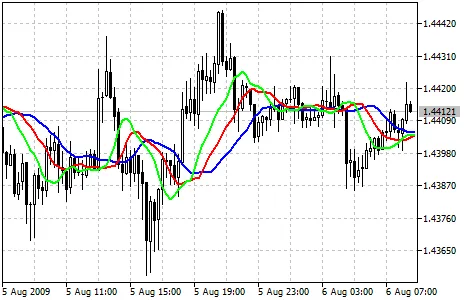
The Blue Line (Alligator's Jaw): This is the Balance Line for the timeframe used to create the chart, calculated as a 13-period Smoothed Moving Average (SMA), shifted 8 bars into the future. The Red Line (Alligator's Teeth): This represents the Balance Line for a timeframe one level lower, calculated as an 8-period SMA, shifted 5 bars into the future. The Green Line (Alligator's Lips): This is the Balance Line for the next lower timeframe, calculated as a 5-period SMA, shifted 3 bars into the future. The interaction between the Lips, Teeth, and Jaw of the Alligator provides insight into different time periods. Remember, clear trends appear only 15% to 30% of the time, so it’s crucial to follow them and avoid getting caught up in sideways markets. When you notice the Jaw, Teeth, and Lips are closed or tangled, it indicates that the Alligator is either asleep or getting ready to wake up. The longer it sleeps, the hungrier it becomes. When it finally awakens, it opens its mouth and yawns, sniffing out potential trades—whether it’s a bullish or bearish opportunity. After chowing down on enough pips, the Alligator loses interest in the price (the Balance Lines converge), signaling it’s time to lock in profits. Alligator Indicator How to Calculate the Alligator Indicator Calculation: MEDIAN PRICE = (HIGH + LOW) / 2 ALLIGATOR'S JAW = SMMA (MEDIAN PRICE, 13, 8) ALLIGATOR'S TEETH = SMMA (MEDIAN PRICE, 8, 5) ALLIGATOR'S LIPS = SMMA (MEDIAN PRICE, 5, 3) Where: MEDIAN PRICE - the average price; HIGH - the highest price of the bar; LOW - the lowest price of the bar; SMMA (A, B, C) - Smoothed Moving Average. A is the data to smooth, B is the smoothing period, and C is the future shift. For instance, SMMA (MEDIAN PRICE, 5, 3) calculates the smoothed moving average based on the median price, with a smoothing period of 5 bars and a shift of 3. ALLIGATOR'S JAW - Alligator's jaws (the blue line); ALLIGATOR'S TEETH - Alligator's teeth (the red line); ALLIGATOR'S LIPS - Alligator's lips (the green line).

2010.01.26
Understanding the Accumulation/Distribution Indicator for MetaTrader 5
MetaTrader5
Understanding the Accumulation/Distribution Indicator for MetaTrader 5

The Accumulation/Distribution (A/D) indicator is a powerful tool that traders use to gauge the relationship between price movement and trading volume. Simply put, it weighs price changes against the volume of trades. The larger the volume, the bigger the impact on the indicator's value. Think of it this way: the A/D indicator is a cousin of the widely-known On Balance Volume (OBV). Both indicators serve to confirm price trends by analyzing the volume of trades. When you see the A/D indicator rising, it suggests that investors are accumulating (or buying) the asset, as most of the trading volume is happening during an upward price trend. Conversely, when the A/D indicator dips, it signals distribution (or selling), indicating that a majority of trades occur as prices fall. Divergences between the A/D indicator and the asset’s price can hint at potential market reversals. For example, if the A/D is climbing while the price is falling, you might want to brace for a price turnaround. How to Calculate the A/D Indicator: To compute the A/D value, a portion of the day’s volume gets added to or subtracted from the previous indicator value. If the closing price is closer to the day’s high, more volume is added; if it’s closer to the day’s low, more volume is deducted. If the closing price lands right in the middle, the indicator remains unchanged. A/D(i) = ((CLOSE(i) - LOW(i)) - (HIGH(i) - CLOSE(i)) * VOLUME(i) / (HIGH(i) - LOW(i)) + A/D(i-1) Where: A/D(i) - the current value of the Accumulation/Distribution indicator; CLOSE(i) - the closing price of the current bar; LOW(i) - the lowest price of the current bar; HIGH(i) - the highest price of the current bar; VOLUME(i) - the trading volume; A/D(i-1) - the value of the A/D indicator from the previous bar.

2010.01.26
Understanding the Awesome Oscillator (AO) for MetaTrader 5
MetaTrader5
Understanding the Awesome Oscillator (AO) for MetaTrader 5

If you're looking to add a robust indicator to your trading toolkit, the Awesome Oscillator (AO), developed by Bill Williams, is a fantastic choice. This indicator measures market momentum by calculating the difference between a 5-period and a 34-period simple moving average based on the median price of the bars, which is computed as (High + Low) / 2. The AO provides traders with insightful signals about the current market driving force. If you’re keen to dive deeper into this, check out Bill Williams's book, New Trading Dimensions. Buy Signals Here are the main signals to look for when considering a buy: Saucer Signal: This signal occurs when the bar chart is above the zero line. Look for three columns: the first column is higher than the second (red), and the third column is higher than the second (green). Remember, all columns must be above the zero line for this signal to be valid. Zero Line Crossing: This signal happens when the bar chart crosses from negative to positive. For this signal to trigger, you'll need just two columns: the first below the zero line and the second crossing it. Two Pikes Signal: This signal appears when both peaks are below the zero line. The first peak is the lowest (pointing down), followed by a second peak that is slightly higher but still negative. Ensure the bar chart remains below the zero line between these peaks. Keep in mind, if the bar chart crosses the zero line between the two pikes, you’ll get a zero line crossing signal instead. Sell Signals The Awesome Oscillator generates sell signals in a similar manner: Saucer Signal: The reverse of the buy signal, where the bar chart is below the zero line. Zero Line Crossing: This occurs when the first column is above the zero line while the second is below it, indicating a downward trend. Two Pikes Signal: Just like the buy signal, but the peaks are now above the zero line. Awesome Oscillator Indicator Calculation To calculate the AO, you’ll need to determine the median price first: MEDIAN PRICE = (HIGH + LOW) / 2 AO = SMA (MEDIAN PRICE, 5) - SMA (MEDIAN PRICE, 34) Where: MEDIAN PRICE: The average of the highest and lowest price of the bar. HIGH: The highest price in the selected period. LOW: The lowest price in the selected period. SMA: Simple Moving Average. Incorporating the Awesome Oscillator into your trading strategy can provide you with a clearer picture of market momentum and help you make more informed decisions. Happy trading!

2010.01.08
Understanding the Accumulation Swing Index (ASI) for MetaTrader 5
MetaTrader5
Understanding the Accumulation Swing Index (ASI) for MetaTrader 5

The Accumulation Swing Index (ASI) is a powerful tool developed by Welles Wilder to help traders navigate the often turbulent waters of price fluctuations. Wilder famously noted, "Somewhere amidst the maze of Open, High, Low, and Close prices is a phantom line that is the real market." The ASI is designed to help us uncover that phantom line. In his book, "New Concepts in Technical Trading Systems", Wilder elaborates on the ASI, stating: "When the Index is plotted alongside the daily bar chart, the trend lines on the ASI can be compared with those on the bar chart. For traders adept at drawing meaningful trend lines, the ASI can serve as a valuable confirmation tool for trend-line breakouts. Often, false breakouts on bar charts won't be validated by the ASI's trend lines, thanks to its focus on closing prices. This means that a quick price spike during the day won't skew the index too much." The ASI aims to reflect the "real market," making it closely aligned with actual price movements. This characteristic allows traders to apply traditional support and resistance analysis to the ASI. Common strategies include watching for breakouts, identifying new highs and lows, and spotting divergences. Here are some key features of the ASI highlighted by Wilder: It provides quantitative insights into price shifts; It identifies short-term turning points; It offers clarity on the market's true strength and trend. Accumulation Swing Index Indicator Calculation: SI(i)=50*(CLOSE(i-1)-CLOSE(i)+0.5*(CLOSE(i-1)-OPEN(i-1))+0.25*(CLOSE(i)-OPEN(i))/R)*(K/T) ASI(i) = ASI(i-1) + SI(i) Where: SI(i) - current value of the Swing Index; SI(i-1) - value of the Swing Index from the previous bar; CLOSE(i) - current close price; CLOSE(i-1) - previous close price; OPEN(i) - current open price; OPEN(i-1) - previous open price; R - a parameter derived from a complex formula based on the ratio of the current close price to the previous maximum and minimum; K - the greater of two values: (HIGH(i-1) - CLOSE(i)) or (LOW(i-1) - CLOSE(i)); T - the maximum price change during the trading session; ASI(i) - current value of the Accumulation Swing Index.

2010.01.08
First Previous 340 341 342 343 344 345 346 347 348 349 350 Next Last