Technical Indicator

Maximize Your Trading with a Single Moving Average on MetaTrader 4
MetaTrader4
Maximize Your Trading with a Single Moving Average on MetaTrader 4

If you're looking to streamline your trading strategy, optimizing with a single Moving Average might just be the ticket. Unlike the more complex cross-moving average systems, this approach simplifies your analysis and speeds up your optimization process. Utilizing a single moving average allows you to quickly evaluate all moving averages between 10 and 1000. This efficiency means you can get to the heart of your trading strategy in no time! Understanding the Signals When trading with a single moving average, you’ll typically receive three key signals: Buy Signal: The curve is below the candles. Sell Signal: The curve is above the candles. Close Position: The curve is horizontal and frequently crosses the candles. In this case, it’s best to close your positions and wait for a clearer signal. By adjusting the period of the moving average, you can recalibrate your strategy. Checking different time frames—like minute, hourly, or daily—can help confirm the strength of a signal. Generally, signals that align across multiple time frames are more robust. You can also switch to lower time frames to identify precise entry points for long or short trades. Indicator Features This indicator showcases four types of triangles to help visualize your trades: Red Triangle (Thick Border): Indicates a winning short trade. Red Triangle (Thin Border): Indicates a losing short trade. Green Triangle (Thick Border): Indicates a winning long trade. Green Triangle (Thin Border): Indicates a losing long trade. Whenever a new signal is available, the indicator can provide alerts, or you can use voice output by utilizing the speak.dll file, which you can find on MQL5. Optimization Modes You can optimize your strategy in two different modes: Simulated Trading: This mode identifies the best moving average based on profitability. Counting Intersections: This approach focuses on minimizing the number of times the moving average intersects with the candles, aiming for the most effective average. Parameters to Consider Here are some parameters to keep in mind when using this strategy: extern bool bOptimize=true; // Enable to find the best single MA by optimizing (switch time frame to re-optimize) extern bool bOptimizeIntersect=true; // Optimize for minimum intersections, otherwise aim for max profit extern int PeriodMA=400; // Set a specific period if not optimizing extern int Method=0; // MA method: 0 = Simple, 1 = Exponential, 2 = Smoothed, 3 = Linear Weighted extern bool DrawTringles=true; // Draw triangles for simulated trading extern int MinMA=5; // Minimum MA for optimization extern int MaxMA=500; // Maximum MA for optimization extern int StepMA=1; // Step size during optimization, 1 tests every MA, 10 every tenth MA, etc. extern int CountOptimize=300; // Number of candles for optimization extern int RepaintBars=3000; // Candles on which triangles are drawn and win/loss calculated extern bool Alarm=true; // Visible alert for new signals extern bool bSpeak=true; // Voice alert with gspeak While moving average trading can yield solid signals, it also comes with its fair share of false signals. I’m currently exploring more filtering techniques to enhance my moving average expert advisor. As always, trade at your own risk!

2010.09.22
Unlock Trading Potential with the iCrossClose Indicator for MetaTrader 5
MetaTrader5
Unlock Trading Potential with the iCrossClose Indicator for MetaTrader 5

If you're looking to enhance your trading strategy, the iCrossClose Indicator for MetaTrader 5 is a game-changer. This nifty tool allows you to perform various arithmetic operations on the prices of two different symbols and display the results on any other chart you choose.With this indicator, you can easily calculate crosses using multiplication and division, figure out spreads by subtraction, or simply plot data from another symbol directly onto your chart.Fig. 1. The iCrossClose Indicator displaying EURGBP (blue) and its estimated values (red), calculated using EURUSD and GBPUSD, on the lower chart.By default, the iCrossClose Indicator plots the cross of EURGBP, calculated using the values from EURUSD and GBPUSD (as shown in Fig. 1).Input Parameters:S1_Symbol - The first symbol;S1_Invert - A flag to invert the value of the first symbol (value = 1.0/value);S1_K - A multiplication coefficient for the first symbol (value = K*value);S1_Plus - An addition to the first symbol (value = Plus + value). The order of operations is: invert, multiply, add;S2_Symbol - The second symbol;S2_Invert - A flag to invert the value of the second symbol;S2_K - A multiplication coefficient for the second symbol;S2_Plus - An addition to the second symbol;R_ArithmeticAction - The arithmetic action to perform;R_Invert - A flag to invert the result of the arithmetic action;R_K - A multiplication coefficient for the result;R_Plus - An addition to the result.Notes:To plot another symbol's data as-is, ensure that S1_Symbol and S2_Symbol are the same, set S2_K to 0, R_ArithmeticAction to Add, and use the default values for the other parameters.If the data isn't ready yet, the indicator will wait for a new tick and display the message "Please wait...". You can also switch timeframes to use it over the weekends.

2010.09.21
Maximize Your Trading Efficiency with QuickFib for MetaTrader 4
MetaTrader4
Maximize Your Trading Efficiency with QuickFib for MetaTrader 4

Overview: Hey fellow traders! If you're like me and constantly on the lookout to streamline your trading process, let me introduce you to QuickFib. This nifty indicator automatically updates your Fibonacci study by tracking the lowest low and the highest high in the currently visible section of your chart. It’s a game-changer for price action traders who are always adjusting their fibs to reflect new highs and lows. QuickFib doesn’t just stop there. It also draws two lines: one connecting the highest high to the point that creates the steepest trend-line slope, and the opposite for the support line. This visual aid can really help in understanding the market structure at a glance. But wait, there’s more! The indicator highlights a rectangle that shows the amount of the move that has not been retraced since the last highest high or lowest low. This feature is especially handy when you're only viewing the right-most part of your chart—whether it's due to overlapping charts or simply dragging your view off-screen. You can quickly see how much retracement has happened without needing to scroll back through all those candles. Plus, if you prefer not to see this feature, you can easily toggle it off by changing the external variable DrawRetracementBlocks to false. Overall, QuickFib gives you a solid understanding of the recent price action for the pair you’re trading. Key Points to Consider: When the price hits a new high or low, the indicator waits for the bar to close before updating the fibs and trend lines. For trend-line breaks, it actually waits for two bars. This gives you a chance to observe a breakout in real-time, which is super helpful for spotting breakout-pullback entries. The indicator updates in a "lazy" manner, meaning that objects are deleted and redrawn for each tick. While this could be optimized further, the current setup has a minimal resource drain on your computer, making it efficient as is. Pro Tip: If you haven’t already, try toggling on the chart shift feature. Click the icon with the small red left-pointed arrow. Adding extra space to the right of your chart can help you visualize future price action and give your mind a comfortable buffer to anticipate potential movements.

2010.09.20
Unlock Trading Potential with the RSI Ichimoku Indicator for MetaTrader 4
MetaTrader4
Unlock Trading Potential with the RSI Ichimoku Indicator for MetaTrader 4

Hey fellow traders, I created this RSI Ichimoku Indicator for my own trading, and it’s been a game-changer! I thought it was time to share it with you all. This indicator builds on the classic MT4 Ichimoku Kinko Hyo setup but tracks RSI values in a handy sub-window. It’s perfect for confirming other trading strategies, or if you’re all about Ichimoku, it makes a stellar addition to your charts. One standout feature I’ve noticed—illustrated in the live trade examples below—is how the GREEN Chinkou Span line signals potential tops and bottoms, or indicates a brief consolidation within a trend. Another sweet spot comes when all three lines pierce through the clouds simultaneously, as illustrated in my trade example. It works wonders, especially if you see the price has some breathing room—ideally, at least 13 pips to resistance. Just a heads-up, I closed my trade right after the 70 RSI line confirmed a reject, as news was looming. It turned into a nice little pre-news scalp for me! When you add this indicator to your chart, just tweak the last color to match your chart’s theme so the clouds appear to float seamlessly. UPDATE: Quick note: Version 2 now includes an automatic shading system that adjusts to match your chart's colors right away. Make sure to enable DLLs for the automatic version. This feature saves you the hassle of manually matching colors, allowing the clouds to look like they’re floating. Once you load it, the auto color will take just 1 tick to sync with your chart's colors. If you want to explore more indicators with auto color changes, feel free to check out my website. www.Brooky-Indicators.com

2010.09.15
Mastering Multi-Timeframe Moving Averages in MetaTrader 5
MetaTrader5
Mastering Multi-Timeframe Moving Averages in MetaTrader 5

Author: traderak20, based on iUniMA.mq5 by Integer If you're looking to up your trading game, the iUniMA MTF (Multi-Timeframe) indicator is a tool you won't want to miss. This handy indicator lets you choose from various types of moving averages, including SMA, EMA, SMMA, LWMA, AMA, DEMA, TEMA, FRAMA, and VIDYA. You can apply it to any timeframe, whether it's higher or lower than your current chart's timeframe. What's cool about this indicator is that it offers an additional setting for a second timeframe to use for calculations. If you're working with a timeframe lower than your current one, the indicator will adapt to provide the most relevant values based on the price type you choose. Here are a couple of examples: Example 1: timeframe_1 = 5 minutes, timeframe_2 = 1 minute, calculations based on Close price series: For any bar on timeframe_1, the indicator will display the latest bar from timeframe_2 that has a Close time before or at the Close time of the bar on timeframe_1. This applies to both closed bars and the current open bar. Example 2: timeframe_1 = 5 minutes, timeframe_2 = 1 minute, calculations based on Open price series: In this case, the indicator will show the latest bar from timeframe_2 with an opening time before or at the Open time of the bar on timeframe_1. The idea here is that if you're calculating your indicators based on the Open time, you’re likely looking to trade when a new bar opens. Hence, at the Open of a new 5-minute bar, you’ll only see the Open of the first of the five 1-minute bars that make it up, ignoring the rest. The great part is you can mix and match any timeframes—even if they don’t sync perfectly, like timeframe_1 = 5 minutes and timeframe_2 = 12 minutes. The indicator will ensure they stay in sync, working similarly to the examples above. Pro Tip: When switching between timeframes, give it a few seconds for the price data to load. If the indicator doesn’t show up, try refreshing the chart manually. To manage error messages, check the source code: bool  ShowErrorMessages=false;      // Enable or disable error messages for debugging Update History: 2010 09 26: v03 Improved display of values on timeframes smaller than the chart's timeframe; Set buffers to EMPTY_VALUE instead of 0 after: if(convertedTime<tempTimeArray_TF2[0]); Code optimization; Removed PLOT_DRAW_BEGIN from OnInit() - inherited from single time frame indicator; Moved ArraySetAsSeries of buffers and arrays into OnInit(); 2010 08 28: v02 Indicator first published;

2010.08.28
Mastering the Doji Hunter Indicator for MetaTrader 4
MetaTrader4
Mastering the Doji Hunter Indicator for MetaTrader 4

If you're diving into the world of trading with MetaTrader 4, the Doji Hunter indicator is a must-have tool in your arsenal. It’s designed to help you spot doji candles efficiently, and I’ve made some tweaks to enhance its performance. Understanding the RangeOfBars Variable To kick things off, I added a RangeOfBars variable. This nifty feature lets you specify how many bars back from the current candle you want to check for dojis. By setting it to 2 or 3, you can identify potential double dojis, giving you an edge in your trading strategy. For instance, you could create a method for IsDoji that focuses solely on the first candle position, and then establish another method to check both the first and second positions for double dojis. This way, your code can easily dictate when to trade or not—like saying, if IsDoji, then no trade, but if IsDoubleDoji, trade on extension! Improved Coding for Efficiency The previous version of the Doji Reader 2 didn't handle 5-digit conditions very well. No worries, though! I've streamlined the code to make it more efficient. While I won't claim mine is the ultimate solution, it's definitely a step in the right direction. Keeping it Simple with ShowCandleBox I opted to maintain the ShowCandleBox feature because it’s a great way to visualize indicators on your chart, and it performed well during testing. While extra indicators and text can be educational, I wanted to keep things straightforward to avoid overwhelming users. Precision Matters: Switching to Doubles A significant change I made was to switch the configuration values from integers to doubles. This shift allows us to leverage 5-digit precision, resulting in a cleaner and more accurate doji detection. Just a heads-up: when using indicators based on doubles, avoid integers unless you’re counting something specific. Counter Reset for Accurate Tracking I also implemented a counter reset to prevent the boxes from piling up during the counting process. Previously, the indicator kept cycling the same counter up and up. Now, with the reset feature, we can maintain an accurate count that refreshes at the start of each processing cycle. Buffer Management for Efficient Processing To enhance performance, I added a buffer cleaning process, allowing you to pass 0 by default and 1 when a doji is detected. By keeping the range small, we avoid unnecessary CPU usage processing outdated data that no longer interests us. Sample Declaration for Your Code Here’s a quick sample declaration to integrate into your code: extern string __DOJI_HUNTER_SETTINGS = "-----"; int RangeOfBars = 3; bool ShowCandleBox = true; //false to hide the candle box extern color BoxColor = MistyRose; //choose your favorite color Getting Doji Data: A Quick Call Example To get started with retrieving doji data, make sure you place this call in the new candle event section of your code. Placing it in the tick event could lead to issues: Doji1 = iCustom(NULL, 0, "Doji_Hunter",        RangeOfBars, ShowCandleBox, BoxColor, FindRegularDoji,        MinLengthOfUpTail, MinLengthOfLoTail, MaxLengthOfBody,        FindDragonflyDoji, MaxLengthOfUpTail1, MinLengthOfLoTail1,        MaxLengthOfBody1, FindGravestoneDoji, MinLengthOfUpTail2,        MaxLengthOfLoTail2, MaxLengthOfBody2, 0, 0); 
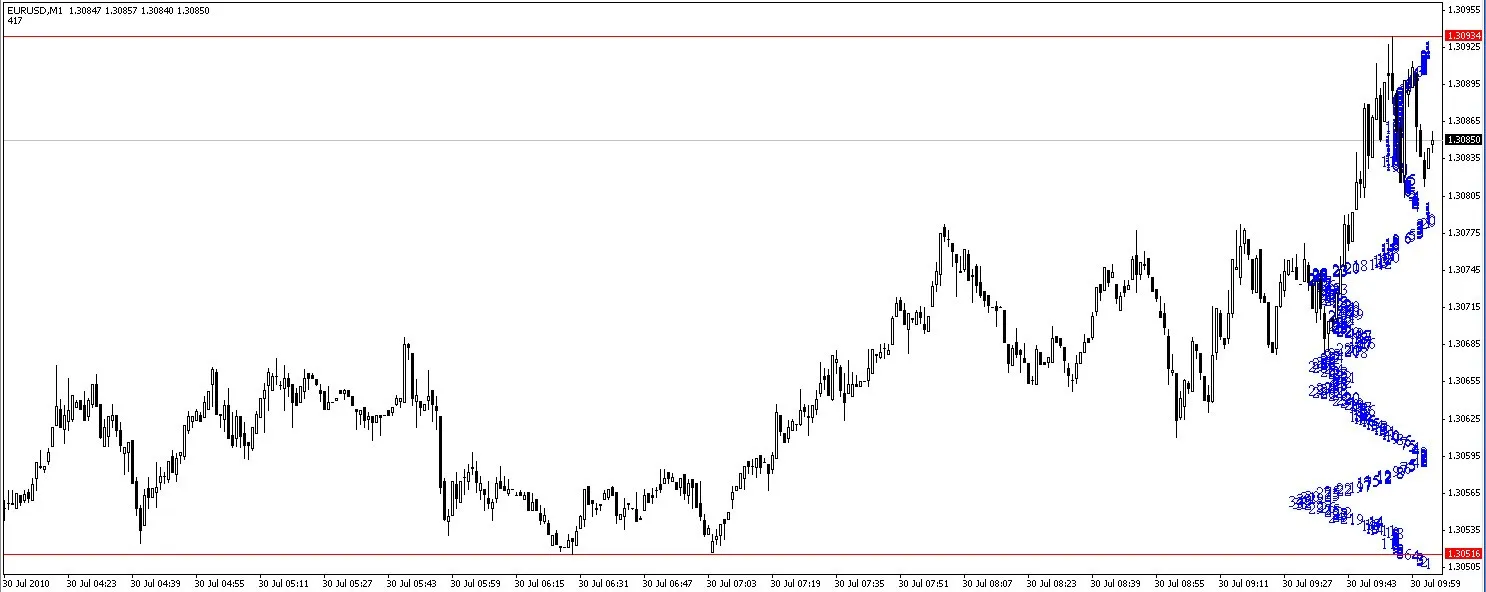
This code snippet will give you the first candle location value of either 0 or 1, where 1 indicates that a doji has been found. Happy trading, and may your charts be filled with profitable doji patterns!

2010.08.28
Mastering the Stochastic Multi-Timeframe Indicator for MetaTrader 5
MetaTrader5
Mastering the Stochastic Multi-Timeframe Indicator for MetaTrader 5

If you're looking to take your trading to the next level, the Stochastic multi-timeframe indicator for MetaTrader 5 is a game-changer. This tool can be applied across any timeframe, whether it's higher or lower than the one you're currently viewing. You can utilize all the standard settings available with the built-in iStochastic indicator. The only additional parameter you'll need to set is the second timeframe that will feed into the calculations. Keep in mind that when you're applying the indicator to a timeframe that's shorter than the one on your chart, it might not display all values. Depending on the price type you choose, it will adopt a different methodology to provide the most relevant value. Here are a couple of examples to illustrate: Example 1: If you set timeframe_1 to 5 minutes and timeframe_2 to 1 minute, using the Close price series: For each bar on the 5-minute timeframe, the indicator will reflect the latest available 1-minute bar that closed before or at the same time. This applies to both closed bars and the current bar that's still open. Example 2: If you set timeframe_1 to 5 minutes and timeframe_2 to 1 minute, using the Open price series: Here, the indicator will show the last 1-minute bar that opened before or at the opening time of the 5-minute bar. This means that when a new 5-minute bar opens, you'll only have the opening price of the first of the five 1-minute bars constituting it, while the rest will be disregarded in the calculations. Feel free to mix and match any timeframes, even if they don’t align perfectly. For instance, you can set timeframe_1 to 5 minutes and timeframe_2 to 12 minutes, and the indicator will ensure they stay in sync, operating on the same principles as outlined above. For a more visual breakdown, check out the MACD Histogram MTF MC indicator, which provides an Excel overview. Quick Tip: When switching between timeframes, give it a few seconds to load the price data. If the indicator doesn’t show up, try refreshing the chart manually. To toggle error messages on or off for debugging, check out the source: bool  ShowErrorMessages=false      // turn on/off error messages for debugging Update History: Version 04 (2010-09-26): Enhanced display of values on smaller timeframes; Adjusted buffers to EMPTY_VALUE instead of 0; Optimized code; Removed PLOT_DRAW_BEGIN from OnInit(); Moved ArraySetAsSeries of buffers and arrays into OnInit(); Version 03 (2010-09-06): Fixed a bug with the Time[] array causing display issues; Version 02 (2010-08-25): Initial publication of the indicator;

2010.08.25
Mastering the RSI Multi-Timeframe Indicator for MetaTrader 5
MetaTrader5
Mastering the RSI Multi-Timeframe Indicator for MetaTrader 5

The RSI, or Relative Strength Index, is a powerful tool that can be used across any timeframe, whether you're looking at a higher time frame or a lower one than what’s currently displayed on your chart. **Quick Tip:** If you're interested in crafting your own multi-timeframe indicators, take a look at this RSI MTF (Multi-Timeframe) indicator as a prime example. It has a single buffer, making the code more streamlined and easier to digest compared to other multi-timeframe indicators that can get pretty bulky. You can utilize all the classic parameters from the built-in iRSI indicator. The only additional setting you'll need is the secondary timeframe that will feed into your calculations. Keep in mind that when you apply the indicator to a timeframe that’s lower than the one on your chart, it can't display all the values at once. So, depending on the type of price you choose, it adopts a different method to provide the most relevant value. Here are two scenarios: Scenario 1: If your timeframe_1 is set to 5 minutes and timeframe_2 to 1 minute, using the Close price series: For any bar on timeframe_1, the indicator will display the most recent bar from timeframe_2 that closed at or before the close of the bar in timeframe_1. This applies to both closed bars and the current open bar. Scenario 2: With timeframe_1 at 5 minutes and timeframe_2 at 1 minute, but calculating based on the Open price series: For each bar in timeframe_1, the indicator will show the latest bar from timeframe_2 that opened at or before the open of the bar in timeframe_1. This is particularly useful because if you're trading based on the open of a new bar, you’ll only have the open of the first of the five 1-minute bars that make up that 5-minute bar. The opens of the subsequent 1-minute bars are ignored in the calculations. You can mix and match any time frames, even if they’re not synchronized, like using timeframe_1 as 5 minutes and timeframe_2 as 12 minutes. The indicator ensures they stay in sync, employing a method similar to the scenarios above. For a more visual take on this, check out the MACD Histogram MTF MC indicator, which includes a handy Excel sheet for better understanding. Heads Up! When switching between timeframes, give it a few seconds for the price data to load properly. If you don't see the indicator, try refreshing the chart manually. To toggle error messages, look into the source code: bool  ShowErrorMessages=false;      // turn on/off error messages for debugging Update History: 2010-09-26: v04 Improved value display for timeframes smaller than the chart's timeframe; Set buffers to EMPTY_VALUE instead of 0 after: if(convertedTime<tempTimeArray_TF2[0]); Optimized code; Removed PLOT_DRAW_BEGIN from OnInit() - inherited from single timeframe indicator; Moved ArraySetAsSeries of buffers and arrays into OnInit(); 2010-09-06: v02 Fixed a bug with Time[] array that led to incorrect drawing of the indicator; 2010-08-25: v01 Initial release of the indicator;

2010.08.25
Mastering the MACD Histogram: A Multi-Timeframe Indicator for MetaTrader 5
MetaTrader5
Mastering the MACD Histogram: A Multi-Timeframe Indicator for MetaTrader 5

If you're looking to enhance your trading strategy, the MACD Histogram is a versatile tool that you can apply across various timeframes, whether you're dealing with short or long-term charts. This indicator calculates values based on the common price types. However, when using it on a shorter timeframe than the current chart's timeframe, not all values can be displayed. Instead, depending on your chosen price type, the indicator adapts to provide the most relevant information. Here are two scenarios to illustrate this: Scenario 1: timeframe_1 = 5 minutes, timeframe_2 = 1 minute, calculations based on Close price series: For each bar on timeframe_1, the indicator will show the most recent bar from timeframe_2 that has a Close time equal to or earlier than the Close time of the bar on timeframe_1. This applies to both closed bars and the currently open bar. Scenario 2: timeframe_1 = 5 minutes, timeframe_2 = 1 minute, calculations based on Open price series: In this case, the indicator will display the latest bar from timeframe_2 that has an opening time equal to or before the Open time of the bar on timeframe_1. This logic assumes that if you're calculating indicators based on the Open time, you likely trade when a new bar opens. So, at the start of a new 5-minute bar, you'll only see the Open of the first of the five 1-minute bars that make it up, ignoring the Opens of the remaining bars. Feel free to mix and match different timeframes, even if they don't align, such as timeframe_1 = 5 minutes and timeframe_2 = 12 minutes. The indicator seamlessly keeps everything in sync, using similar logic as discussed above. To help you get a clearer picture, I’ve attached an Excel sheet (Conversion between timeframes.zip) that outlines all possible combinations along with a visual explanation. Don't forget to check out the source code for additional insights, which should help you create your own multi-timeframe indicators. Pro Tip: When switching between timeframes, allow a few seconds for the price data to load. If the indicator doesn’t display immediately, just refresh the chart manually. Requirements: MovingAverages.mqh (this is a default file located in terminal_data_folder\MQL5\Include) MACD_Histogram_MC (also available on mql5.com) Make sure to place both MACD Histogram_MTF_MC.mq5 and MACD_Histogram_MC.mq5 in the terminal_data_folder\MQL5\Indicators for the indicator to function properly. You can also check the source code to enable or disable error messages for debugging purposes: bool ShowErrorMessages=false;      // turn on/off error messages for debugging Update History: 2010 09 26: v03 Improved value display on smaller timeframes; Set buffers to EMPTY_VALUE instead of zero after: if(convertedTime<tempTimeArray_TF2[0]); Optimized code for better performance; Removed PLOT_DRAW_BEGIN from OnInit() - an inherited feature from single timeframe indicators; Moved ArraySetAsSeries of buffers and arrays into OnInit(); Added MODE_SMMA and MODE_LWMA as MA methods for the Signal line; Adjusted ENUM_APPLIED_PRICE to be the last input parameter on the list; 2010 08 28: v02B Indicator was first published;

2010.08.24
First Previous 331 332 333 334 335 336 337 338 339 340 341 Next Last