Technical Indicator

Unlock Trading Potential with LoongMAx96: A Must-Have Indicator for MetaTrader 5
MetaTrader5
Unlock Trading Potential with LoongMAx96: A Must-Have Indicator for MetaTrader 5

Author: Loong Introducing LoongMAx96—an innovative indicator designed for MetaTrader 5 that efficiently draws 96 moving average lines using just 100 lines of code, thanks to the MyBuffer class. The concept originated from discussions on Rosh's topic, and you can explore those threads here: Forum Thread 1 Forum Thread 2 In Chinese, the term is known as "jun xian liu," which translates to "Moving Average Line Flow." The goal was to streamline the multi-indicator template into a single multi-line indicator. However, this approach often leads to a lot of repetitive code. Initially, I considered using a two-dimensional array—one dimension for the time index and another for the MAs index. Unfortunately, MQL4 limits us to just 8 lines for indicators. Thankfully, with MetaTrader 5 and MQL5, we gained support for classes, allowing for a more efficient one-dimensional approach. This led to the first version of LoongMAx96, which you can check out in this forum thread: Version Discussion (Note: the old class named CIndicatorBuffer had a naming conflict with Indicator.mqh). Subsequent improvements and discussions were held in this thread: New Version Discussion. A special thanks to 'Rosh' and 'investeo' for their contributions! And now, I’m excited to share the latest version with you. Input Parameters: Worried about parameters? Don’t be! LoongMAx96 operates beautifully right out of the box without any need for adjustments.

2010.02.15
Trend Paint: An Essential MT4 Indicator for Visual Strategy Evaluation
MetaTrader4
Trend Paint: An Essential MT4 Indicator for Visual Strategy Evaluation

If you're looking to enhance your trading experience on MetaTrader 4, let me introduce you to the Trend Paint indicator. The main idea behind this tool is to give you a visual representation of your trading strategy's performance. When the indicators signal an upward trend, the bars are painted green. Conversely, in a downward trend, you'll see them turn red. And if the market is moving sideways (or if the indicators are lagging), the bars will appear gray. This color-coding allows you to quickly gauge market conditions at a glance. This approach has proven to be effective. Besides the readings from the tester, it provides a clear visual on the chart, making it easier to spot entry and exit points, as well as time spent out of the market. The Trend Paint indicator comes pre-loaded with MA Rounding Off and Parabolic (Open-Close) features. If you're interested, you can check out my previous work for a deeper dive into these indicators. You can customize this indicator to fit any trading strategy you have in mind—just let your creativity flow! As a tip, I highly recommend adjusting the chart settings to match the color of your screen. The visuals will look absolutely stunning! Best regards, Backspace. P.S. The idea of coloring the bars using DRAW_HISTOGRAM came from one of the members in this chat. A big thanks to him! Unfortunately, I can’t recall his name, but I’ll definitely give him credit once I find it.

2010.02.11
Understanding the Variable Index Dynamic Average (VIDYA) for MetaTrader 5
MetaTrader5
Understanding the Variable Index Dynamic Average (VIDYA) for MetaTrader 5

The Variable Index Dynamic Average (VIDYA) is a unique technical indicator crafted by Tushar Chande that every trader should have on their radar. Unlike the standard Exponential Moving Average (EMA), VIDYA features a dynamically changing averaging period based on market volatility. This volatility is gauged using the Chande Momentum Oscillator (CMO). The CMO measures the ratio of positive price changes to negative price changes over a specified period. This value is then utilized as the smoothing factor for the EMA, which means you'll need to set parameters for both the CMO and EMA periods when using VIDYA. How to Use VIDYA Typically, traders don't solely rely on VIDYA itself but rather on its upper and lower bands, which are set N% above and below the VIDYA line. This interpretation is akin to how you’d analyze Bollinger Bands® for trade signals. Variable Index Dynamic Average Indicator How is VIDYA Calculated? The standard Exponential Moving Average is calculated using the following formula: EMA(i) = Price(i) * F + EMA(i-1) * (1 - F) Where: F: Smoothing factor = 2 / (Period_EMA + 1); Period_EMA: The length of the EMA period; Price(i): Current price; EMA(i-1): Previous EMA value. The VIDYA value is then calculated similarly using the CMO: VIDYA(i) = Price(i) * F * ABS(CMO(i)) + VIDYA(i-1) * (1 - F * ABS(CMO(i))) Where: ABS(CMO(i)): Absolute value of the current Chande Momentum Oscillator; VIDYA(i-1): Previous VIDYA value. Finally, the CMO itself is calculated using this formula: CMO(i) = (UpSum(i) - DnSum(i)) / (UpSum(i) + DnSum(i)) Here: UpSum(i): Current sum of positive price changes over the period; DnSum(i): Current sum of negative price changes over the period.

2010.02.03
Understanding the Triple Exponential Moving Average (TEMA) for MetaTrader 5
MetaTrader5
Understanding the Triple Exponential Moving Average (TEMA) for MetaTrader 5

The Triple Exponential Moving Average (TEMA) is a powerful technical indicator that was crafted by Patrick Mulloy and featured in the "Technical Analysis of Stocks & Commodities" magazine. The way TEMA is calculated is quite similar to the Double Exponential Moving Average (DEMA). Despite its name, the Triple Exponential Moving Average doesn’t quite capture the essence of its algorithm. It’s actually a unique combination of single, double, and triple exponential smoothing averages that results in a smaller lag than any of the individual components. Traders often opt for TEMA instead of traditional moving averages, as it can effectively smooth price data and even other indicators. 
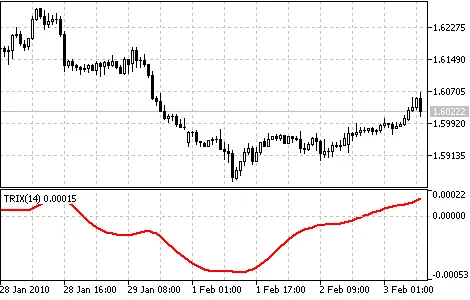
Triple Exponential Moving Average Indicator How TEMA is Calculated: The calculation begins by finding the DEMA, followed by determining the error of the price deviation from DEMA: err(i) = Price(i) - DEMA(Price, N, ii) In this formula: err(i) - the current DEMA error; Price(i) - the current price; DEMA(Price, N, i) - the current DEMA value based on the Price series over N periods. Next, we add the value of the exponential average of the error to get the TEMA: TEMA(i) = DEMA(Price, N, i) + EMA(err, N, i) = DEMA(Price, N, i) + EMA(Price - EMA(Price, N, i), N, i) == DEMA(Price, N, i) + EMA(Price - DEMA(Price, N, i), N, i) = 3 * EMA(Price, N, i) - 3 * EMA2(Price, N, i) + EMA3(Price, N, i) Here’s what the terms mean: EMA(err, N, i) - the current value of the exponential average of the error; EMA2(Price, N, i) - the current value of the double sequential price smoothing; EMA3(Price, N, i) - the current value of the triple sequential price smoothing.

2010.02.03
Mastering the Double Exponential Moving Average (DEMA) for Better Trading
MetaTrader5
Mastering the Double Exponential Moving Average (DEMA) for Better Trading

The Double Exponential Moving Average (DEMA) is a powerful technical indicator that was created by Patrick Mulloy and first introduced in February 1994 in the "Technical Analysis of Stocks & Commodities" magazine. This indicator is particularly handy for smoothing out price series and is applied directly to the price chart of various financial securities. Plus, it can also be used to smooth values of other indicators. One of the standout benefits of DEMA is its ability to filter out false signals that often occur in jagged price movements, allowing you to maintain your position during strong trends. This can be a game-changer for traders looking to capitalize on market momentum. Double Exponential Moving Average Indicator How DEMA is Calculated: The DEMA is based on the Exponential Moving Average (EMA). To understand how it works, let’s take a look at the error of price deviation from the EMA value: err(i) = Price(i) - EMA(Price, N, i) Where: err(i) - the current EMA error; Price(i) - the current price; EMA(Price, N, i) - the current EMA value of the price series over N periods. Next, we add the value of the exponential average error to the value of the exponential moving average of the price: DEMA(i) = EMA(Price, N, i) + EMA(err, N, i) = EMA(Price, N, i) + EMA(Price - EMA(Price, N, i), N, i) == 2 * EMA(Price, N, i) - EMA(Price - EMA(Price, N, i), N, i) = 2 * EMA(Price, N, i) - EMA2(Price, N, i) Where: EMA(err, N, i) - the current value of the exponential average of error err; EMA2(Price, N, i) - the current value of the double smoothing of prices.

2010.02.03
Mastering the Fractal Adaptive Moving Average (FrAMA) for Your MetaTrader 5 Trading
MetaTrader5
Mastering the Fractal Adaptive Moving Average (FrAMA) for Your MetaTrader 5 Trading

Fractal Adaptive Moving Average (FrAMA) is a cutting-edge technical indicator developed by John Ehlers that you can use in MetaTrader 5. It’s designed to help traders like us make sense of price movements and identify trends effectively. The beauty of FrAMA lies in its foundation on the Exponential Moving Average (EMA), with a twist. Instead of a static smoothing factor, FrAMA dynamically calculates this based on the current fractal dimension of the price series. What does this mean for us? Simply put, it allows us to ride strong trends while also adapting during periods of price consolidation. Just like with any moving average, you can apply all sorts of analysis techniques to FrAMA. Fractal Adaptive Moving Average Indicator How It's Calculated: FRAMA(i) = A(i) * Price(i) + (1 - A(i)) * FRAMA(i-1) Where: FRAMA(i) - the current value of FrAMA; Price(i) - the current price; FRAMA(i-1) - the previous value of FrAMA; A(i) - the current factor of exponential smoothing. The exponential smoothing factor is calculated using the following formula: A(i) = EXP(-4.6 * (D(i) - 1)) Where: D(i) - the current fractal dimension; EXP() - the exponent function. To understand how this works, consider that the fractal dimension of a straight line is 1. If D = 1, then A = 1, meaning that during straight-line price movements, the formula simplifies to: FRAMA(i) = 1 * Price(i) + (1 - i) * FRAMA(i-1) = Price(i) In this case, the indicator tracks the price exactly. On the other hand, if we’re looking at a more complex scenario, the fractal dimension for a plane is 2. Here, if D = 2, we find that the smoothing factor A becomes quite small (around 0.01) during strong, jagged price movements. This effectively behaves like a 200-period simple moving average, giving us a nice slowdown during volatile periods. Now, let’s break down the formula for the fractal dimension: D = (LOG(N1 + N2) - LOG(N3))/LOG(2) This is calculated using another formula: N(Length,i) = (HighestPrice(i) - LowestPrice(i))/Length Where: HighestPrice(i) - the highest price over the last Length periods; LowestPrice(i) - the lowest price over the last Length periods. The values N1, N2, and N3 are defined as follows: N1(i) = N(Length,i)N2(i) = N(Length,i + Length)N3(i) = N(2 * Length,i)

2010.02.03
Understanding Bulls Power: A Key Indicator for MetaTrader 5
MetaTrader5
Understanding Bulls Power: A Key Indicator for MetaTrader 5

In the day-to-day trading arena, it's a constant tug-of-war between buyers, known as "Bulls," driving prices up, and sellers, or "Bears," pushing them down. The closing price of any given day will show whether the Bulls or Bears came out on top. By looking at intermediate results, particularly the day’s highest and lowest prices, we can gauge how the battle played out. Being able to assess the balance of Bulls Power is crucial, as shifts in this balance can signal potential trend reversals. This is where the Bulls Power oscillator comes into play, a tool developed by Alexander Elder and detailed in his book "Trading for a Living: Psychology, Trading Tactics, Money Management". Elder's oscillator is grounded in a couple of key concepts: The moving average represents a price consensus between buyers and sellers over a set period. The highest price of the day reflects the peak strength of the buyers. With these ideas in mind, Elder formulated Bulls Power as the difference between the highest price of the day and the 13-period exponential moving average (HIGH - EMA). How to Use Bulls Power This indicator works best in tandem with a trend indicator, like a Moving Average. Here’s how to interpret it: If the trend indicator points downward and the Bulls Power index is above zero but declining, consider this a sell signal. It’s also ideal to look for peak divergences forming on the indicator chart in this scenario. Calculation of Bulls Power To calculate this indicator, you start with the exponential moving average, typically the 13-period EMA. BULLS = HIGH - EMA Where: BULLS - Represents the Bulls' Power; HIGH - The highest price of the current bar; EMA - The Exponential Moving Average. In an uptrend, when HIGH exceeds EMA, Bulls Power is above zero, and the histogram will sit above the zero line. Conversely, if HIGH dips below EMA as prices fall, Bulls Power will drop below zero, and its histogram will fall under the zero line.

2010.01.26
Mastering the ZigZag Indicator for MetaTrader 5: A Trader's Guide
MetaTrader5
Mastering the ZigZag Indicator for MetaTrader 5: A Trader's Guide

Hey fellow traders! Today, let’s dive into the ZigZag indicator, which is a handy tool for anyone using MetaTrader 5. This indicator helps us visualize significant price movements by connecting the important highs and lows on the price chart. So, what’s the deal with the ZigZag? Well, it uses a minimum price change parameter to determine how much the price needs to move before it draws a new "Zig" or "Zag" line. This means it filters out those little price wiggles that can cloud our analysis. In a nutshell, the ZigZag indicator highlights only the major shifts in price. Most traders, including myself, use the ZigZag to simplify our charts. It’s like having a clean lens to focus on the most critical price movements. Plus, it can help us identify Elliot Waves and various chart patterns, making it a versatile ally in our trading toolkit! Now, here’s a little tip: the last segment of the ZigZag indicator can change as new price data comes in. This can be a bit tricky because a price movement can alter previous values. So, while the ZigZag is fantastic for analyzing past price actions, it’s not the best for forecasting future moves. It’s more about looking back at what has happened rather than predicting what will happen next. In conclusion, while the ZigZag indicator is a great tool for analyzing historical price changes, be cautious about using it as the foundation for a trading system. Instead, think of it as a tool to enhance your understanding of market movements!

2010.01.26
Mastering Williams’ Percent Range (%R) for Trading Success
MetaTrader5
Mastering Williams’ Percent Range (%R) for Trading Success

Williams’ Percent Range (%R) is a powerful technical indicator that helps traders identify overbought and oversold market conditions. Similar to the Stochastic Oscillator, the key difference lies in the presentation; %R uses an inverted scale. When you look at the %R values, you’ll notice they’re displayed with a negative sign (for instance, -30%). Don’t let that throw you off—just ignore the minus sign while analyzing the data. In general, if the indicator shows values between 80% and 100%, it suggests that the market is oversold. Conversely, values from 0% to 20% indicate an overbought market. As with any overbought/oversold indicators, patience is key! It’s best to wait for the price to shift direction before executing your trades. For example, if the %R indicates an overbought condition, hold off on selling until the price starts to decline. One fascinating aspect of the Williams %R is its knack for predicting price reversals. Often, the indicator will peak and start to drop a few days before the actual security price does. Likewise, it tends to form a trough and rise before the price turns up. Williams’ Percent Range indicator How to Calculate %R: Here’s the formula for calculating the %R indicator, which closely resembles that of the Stochastic Oscillator: %R = (HIGH(i-n) - CLOSE) / (HIGH(i-n) - LOW(i-n)) * 100 Where: CLOSE - today’s closing price; HIGH(i-n) - the highest price over the last number (n) of periods; LOW(i-n) - the lowest price over the last number (n) of periods.

2010.01.26
Understanding the Williams Accumulation/Distribution Indicator for MetaTrader 5
MetaTrader5
Understanding the Williams Accumulation/Distribution Indicator for MetaTrader 5

The Williams Accumulation/Distribution (W_A/D) indicator is a valuable tool for traders, designed to analyze the cumulative sum of positive and negative price movements in the market. Here's how it works: when the closing price of an asset is higher than its previous closing price, the W_A/D increases by the difference between the current closing price and the true minimum price. Conversely, if the current closing price is lower, the W_A/D decreases based on the difference between the current closing price and the true maximum price. In trading terms, "accumulation" refers to a market where buyers are in control, while "distribution" indicates that sellers are dominating. Divergences between the W_A/D indicator and the asset's price can signal potential market movements. Typically, when you notice a divergence, the price tends to reverse in line with the indicator's direction. If the price hits a new high but the W_A/D doesn’t follow suit, it’s a red flag that the asset might be in the distribution phase—consider this a sell signal. If the price reaches a new low while the W_A/D fails to do the same, it suggests accumulation is happening—this is a potential buy signal. Williams' Accumulation/Distribution Indicator How to Calculate the W_A/D: To calculate the W_A/D, you’ll first need to determine the True Range High (TRH) and True Range Low (TRL): TRH (i) = MAX (HIGH (i) || CLOSE (i - 1))TRL (i) = MIN (LOW (i) || CLOSE (i - 1)) Next, find the current value of the W_A/D by comparing today’s and yesterday’s closing prices. If today’s closing price is higher than yesterday’s closing price, use this formula: CurA/D = CLOSE (i) - TRL (i) If today’s closing price is lower, you’ll want to use: CurA/D = CLOSE (i) - TRH (i) If the closing prices are the same, then: CurA/D = 0 The Williams Accumulation/Distribution indicator is simply the running total of these values: W_A/D (i) = CurA/D + W_A/D (i - 1) Where: TRH (i) - the True Range High; TRL (i) - the True Range Low; MIN - the minimum value; MAX - the maximum value; || - the logical OR; LOW (i) - the minimum price of the current bar; HIGH (i) - the maximum price of the current bar; CLOSE (i) - the closing price of the current bar; CLOSE (i - 1) - the closing price of the previous bar; CurA/D - the current value of accumulation/distribution; W_A/D (i) - the current value of the Williams Accumulation/Distribution indicator; W_A/D (i - 1) - the value of the Williams Accumulation/Distribution indicator from the previous bar.

2010.01.26
First Previous 338 339 340 341 342 343 344 345 346 347 348 Next Last