Technical Indicator

Essential Indicator for Evaluating Trading Strategies in MetaTrader 4
MetaTrader4
Essential Indicator for Evaluating Trading Strategies in MetaTrader 4

As traders, we all know that spotting the flaws in our trading strategies can be a game-changer. Wouldn't it be fantastic if we could visualize these weaknesses while also having access to objective trading statistics? Well, now we can! MetaTrader 4 (MT4) has a backtester, but running a visual backtest for every tweak in your EA can be a real time-sink. Plus, its visual capabilities are pretty limited. Testing multi-currency strategies? Forget about it—at least not efficiently. To tackle these challenges, I developed an open-source indicator designed specifically for visually testing trading strategies. While it’s impossible to create a one-size-fits-all indicator, the current framework is flexible enough to be modified for specific needs, including multi-currency strategies. Spread Management A key feature of this indicator is its spread management. It considers spreads just like real trading and the MT4 backtester does. If you decide to modify the indicator for personal use, take a close look at the spread management. Otherwise, you might find that your strategy looks great on a 1-minute chart, but in reality, it could be a total flop! :) As a practical example, I'm including an indicator with a straightforward trading strategy based on moving average (MA) crosses, while also considering price action to allow for trades even before actual crosses occur—helping to reduce lag. The exit strategy is implemented using opposite signals and a slow MA crossing in reverse, along with stop loss management via a modified Chandelier SL strategy. This indicator serves as a template that you can customize, but many traders find it effective enough for manual trading. The Concept Behind This System The system is designed in a modular fashion. We first implement a trading strategy into a trading indicator, which uses two buffers for entry signals, two for exit signals, and one for stop loss. You can find a fully functional sample of this indicator named StrategyIndi_1.0. We can then evaluate this strategy using the strategy testing indicator StrategySym_1.0. If the results don't meet your expectations, optimizing the trading indicator allows you to see changes in real time through objective statistics. When you're ready to implement an EA, it's a breeze. By calling a custom trading indicator, you'll receive all the entry and exit signals along with SL values. How to Use This System and Adapt It to Your Needs To get started with the system, simply copy both indicators into your MetaTrader\experts\indicators folder. Make sure to restart your terminal to compile them properly. Some settings may require adjustment; most are self-explanatory, but here are a few key parameters: StrategyIndi Parameters: ChandBars = 7 (number of bars for the Chandelier SL strategy) ChandATRFact = 2.0 (factor to multiply the long-term ATR for Chandelier distance) RiskPercent = 2.0 (risk percentage of the free account balance for lot calculation) Offset = 10 (offset in pips for placing arrows on the chart) BarsBack = 2000 (number of past bars to process) AlertSound = "alert.wav" (WAV file for sound alerts) UseSoundAlert = true (if you want sound alerts) UsePopupAlert = true (if you want pop-up window alerts) WriteToLog = false (if you want to write log details for debugging) StrategySim Parameters: MaxLossAtSL = 200.0 (maximum loss per SL in account currency) BarsBack = 2000 (number of bars to process for strategy evaluation) WriteToLog = false (if you want to write log details for debugging) When adapting the system to your needs, remember to transfer all relevant parameters from your own StrategyIndi indicator to the StrategySym indicator for simulation purposes. Fixed values can be used for other parameters (like UseSoundAlert). There’s no need to change anything else unless you’re aiming for a different purpose, like multi-currency strategies. In that case, comments and variable names should guide you along the way. If you need help, feel free to reach out at the contact info below. With this system, my goal is to contribute to a more objective evaluation of trading strategies, whether for manual systems or EAs. Current marketing tactics can often be misleading, leading many newcomers to lose their hard-earned cash. Best regards,Robert For comments, MT4 programming assistance, or any inquiries, please contact me at robert [dot] leskovar [at] gmail [dot] com. Please note that the MQLTools website in the source code is no longer active.

2010.04.01
Mastering VSA: A Guide to the Best Indicator for MetaTrader 4
MetaTrader4
Mastering VSA: A Guide to the Best Indicator for MetaTrader 4

Welcome back, fellow traders! Today, we're diving into the exciting world of Volume Spread Analysis (VSA) and how it can enhance your trading strategy on MetaTrader 4. Understanding VSA: VSA is all about reading the market's pulse and mapping it out, giving you a clearer picture of potential future movements. It’s like having a trading compass that helps you navigate through the market’s twists and turns. Decoding the Bars: YellowGreen: This combination suggests an increasing spread and rising volume—indicating strong participation. If you see this, you can expect the price to continue moving in this direction. Red: Here, we have a decreasing spread alongside increasing volume. This signals that the upward movement might be losing steam, so keep your eyes peeled! Blue: An increasing spread with decreasing volume means the price is shifting without strong market participation. It's a sign to be cautious. Gray: This indicates a decreasing spread and volume—essentially, a waiting market. It’s a sign of a dull or congested market, so patience is key. Using MACD with VSA: Now, let’s talk about Multi-Time Frame (MTF) settings. For optimal results, try using VSA on a 15-minute chart while analyzing the H1 chart. Essentially, one H1 bar will encapsulate four 15-minute bars, giving you a more granular view of market movements. Happy trading, and as always, if you have any questions or need further clarification, don’t hesitate to reach out! :)

2010.03.30
Exploring the Market Way Indicator for MetaTrader 4: A Trader's Guide
MetaTrader4
Exploring the Market Way Indicator for MetaTrader 4: A Trader's Guide

Overview: The Market Way indicator might not be the newest tool in the trader's toolkit, but it certainly has its merits. While the concept isn't groundbreaking, it plays a crucial role in helping us understand market movements. This indicator provides a summary of the difference between opening and closing prices over a specific timeframe, focusing on key trends: It calculates only bearish bars; It calculates only bullish bars; It includes a weighted average for the entire period. Benefits: Combines the features of an oscillator and a trend indicator (a significant advantage!). Easy to understand and interpret. Identifies good points for upward or downward movement. Indicates bullish or bearish pressure and estimates movement, which is crucial for setting stop-loss and take-profit levels. Shows the presence and strength of lateral movement (high or low volatility). Highlights overbought and oversold levels. Clearly depicts price movement waves and can signal divergence/convergence levels. Helps forecast future price behavior and is effective for market entry using this indicator alone (very important!). Works well across all timeframes and can be applied to markets beyond forex. Filters out false signals without additional smoothing, maintaining fidelity with the same period SMA. Drawbacks: Requires a settlement period, which can decrease the accuracy of the analyzed data sample size (a common issue with many indicators). Not all capabilities of this indicator have been thoroughly explored. Recommended Parameters: extern int IdMain = 12; // Main line (drawn on the chart) should ideally sit between bullish and bearish lines. extern int IdBull = 12; // Bullish line value, ideally equal to the bear and main line. extern int IdBear = 12; // Bearish line value, ideally equal to the bull line and main line. extern int IdArray = 12; // Smoothing value for all lines on the graph, known as SIGNAL lines. On display, a histogram represents the difference between the bullish line (white bars) and SMA alongside the bearish line (black bars) and its SMA. More detailed information can be found within the indicator's code. Recommended settings are multiples of 12, including numbers divisible by 3 and 4, with a maximum of 108 and a minimum of 12, possibly down to 9 or 7. These recommendations are based on other studies, so treat them as guidelines. This Indicator in Strategy Testing: Here’s an example for building evidence with the indicator. These setups are not optimized, and trades are executed at the opening of a bar, so there’s no need to test every tick—just open one trade per bar. Timeframe: Daily, Tool: EURUSD, period: All available from 1999 to 2010. Stop Loss and Take Profit are set at 500 points. Exit conditions are based on the opposite transaction entry. Conditions for Long Entry: MainAccumulation1 - MainSMA1 > 0 // Main line should be above the smoothed value &amp;&amp; BullPressure1 - Point > 0 // Bullish pressure must be above 0 &amp;&amp; BearPressure1 - Point > 0 // Bearish pressure must be above 0 &amp;&amp; MainAccumulation1 - Point > 0 // Main line should be above 0 Conditions for Short Entry: MainAccumulation1 - MainSMA1 < 0 // Main line should be below its smoothed value &amp;&amp; BullPressure1 - Point < 0 // Bullish pressure must be below 0 &amp;&amp; BearPressure1 - Point < 0 // Bearish pressure must be below 0 &amp;&amp; MainAccumulation1 - Point < 0 // Main line should be below 0 Ensure that exit conditions are strictly the opposite. The following graph displays asset changes (Equity), with a precision of 5 digits. As you can see, after opening any trades, equity rarely drops below -200 points.

2010.03.30
Mastering the Higher Timeframe Trend Indicator for MetaTrader 4
MetaTrader4
Mastering the Higher Timeframe Trend Indicator for MetaTrader 4

Description: The Higher Timeframe Trend Indicator is your go-to tool for gauging the overall trend on a higher timeframe while you’re trading on a lower timeframe. Here’s how it works: If the moving averages (MA) are aligned as follows: MA_1 &lt; MA_2 &lt; MA_3 &lt; MA_4 on the higher timeframe, it signals that a downtrend is in motion. On your current chart, you’ll see a red line indicating this trend. This red line is derived from the Price Channel Index (PCI) and can serve as a support level. If you have the built-in RSI indicator turned on, you’ll get an alert when the RSI enters overbought territory, hinting at a potential reversal. It’s a solid strategy to enter trades when the price closes below this red PCI support line. Conversely, if the moving averages are in the order of MA_1 &gt; MA_2 &gt; MA_3 &gt; MA_4, that indicates an uptrend. You’ll notice a green line on your chart that represents this uptrend. The green line also comes from the PCI and acts as a resistance line. Again, with the RSI enabled, you’ll receive an alert when the RSI dips into oversold territory, suggesting a possible trend reversal. A good entry point would be when the price closes above the green PCI resistance line. A grey line indicates that there’s no significant trend on the higher timeframe. For optimal performance, I recommend the following timeframe combinations: Higher Timeframe: Daily &nbsp;&nbsp;&nbsp;&nbsp; Current Timeframe: 1hr Higher Timeframe: 4hr &nbsp;&nbsp;&nbsp;&nbsp; Current Timeframe: 15min Higher Timeframe: 1hr &nbsp;&nbsp;&nbsp;&nbsp; Current Timeframe: 5min Higher Timeframe: 5/15min &nbsp;&nbsp;&nbsp;&nbsp; Current Timeframe: 1min Image: Properties: extern int Upper_Timeframe = 240; // Upper timeframe in minutes (e.g., 240 = 4hr) extern int Upper_Timeframe_MA_1 = 10; // MA_1 must be the fastest MA extern int Upper_Timeframe_MA_2 = 20; extern int Upper_Timeframe_MA_3 = 50; extern int Upper_Timeframe_MA_4 = 100; // MA_4 must be the slowest MA extern bool RSI_Check_On = true; // Checks for RSI OverBought/OverSold conditions extern bool RSI_Alert_On = true; // Audio alert for RSI OverBought/OverSold conditions extern int RSI_Period = 12; // RSI period extern int Upper_RSI_Limit = 70; // Upper limit indicating overbought conditions extern int Lower_RSI_Limit = 30; // Lower limit indicating oversold conditions extern int PCI_Period = 5; // PCI period; e.g., 5 sets support line in a downtrend to the lowest low from the past 5 bars extern int PCI_Shift = 1; // PCI Shift, best set to 1 extern double Entry_Buffer = 0.0002; // Increases width of PCI channel by specified pips, i.e., lowers support line in a downtrend extern color Dot_Color = Blue;

2010.03.26
Unlock Trading Insights with the DemoBufferPattern Indicator for MetaTrader 5
MetaTrader5
Unlock Trading Insights with the DemoBufferPattern Indicator for MetaTrader 5

If you're looking to enhance your trading strategy, the DemoBufferPattern indicator might just be the tool you need. This indicator combines the power of candles, fractals, and zigzag patterns to give you a clearer view of market trends. Here’s a quick rundown of what this indicator offers: Color Candles: Visualize price movements with vibrant colors. Directional Arrows: Get immediate visual cues on potential trade signals. Zigzag Patterns: Help identify market reversals more effectively. Colored Lines: Quickly spot key levels in the market. Getting Started with DemoBufferPattern To set this indicator up in your MetaTrader 5 platform, you'll need to initialize it properly. Here's a glimpse of the initialization function: //+------------------------------------------------------------------+ //| Custom indicator initialization function | //+------------------------------------------------------------------+ int OnInit() { //--- indicator buffers mapping SetIndexBuffer(0, P1B1, INDICATOR_DATA); SetIndexBuffer(1, P1B2, INDICATOR_DATA); SetIndexBuffer(2, P1B3, INDICATOR_DATA); SetIndexBuffer(3, P1B4, INDICATOR_DATA); SetIndexBuffer(4, P1BC, INDICATOR_COLOR_INDEX); // More buffers... return(0); } //+------------------------------------------------------------------+ Make sure to follow the setup steps precisely to ensure everything runs smoothly. The indicator uses various drawing styles to provide a comprehensive market overview. Visual Representation Check out the image below to see how the DemoBufferPattern indicator looks in action: With the DemoBufferPattern indicator, you can take your trading to the next level, allowing for better-informed decisions. Dive in and see how it can work for you!

2010.03.25
Mastering the Trade Sessions Indicator for MetaTrader 5
MetaTrader5
Mastering the Trade Sessions Indicator for MetaTrader 5

If you're looking to enhance your trading game, the Trade Sessions Indicator for MetaTrader 5 is a handy tool you won't want to miss. This indicator is built on the DRAW_FILLING buffers, allowing you to visualize trading sessions more effectively. One of the great things about this indicator is its simplicity. It doesn’t come with a complex set of input parameters, relying instead on the TimeTradeServer() and TimeGMT() functions to keep you on track. Keep in mind, though, that the trading session times might not always be spot on. They’re derived from the first source I found, so feel free to tweak the constants for your specific needs. The GMT time serves as the baseline here. // Time constants are specified across Greenwich const int&nbsp;&nbsp; AsiaOpen=0; const int&nbsp;&nbsp; AsiaClose=9; const int&nbsp;&nbsp; AsiaOpenSummertime=1;&nbsp;&nbsp; // The Asian session shifts const int&nbsp;&nbsp; AsiaCloseSummertime=10; // after the time changes const int&nbsp;&nbsp; EuropaOpen=6; const int&nbsp;&nbsp; EuropaClose=15; const int&nbsp;&nbsp; AmericaOpen=13; const int&nbsp;&nbsp; AmericaClose=22; Additionally, you can take advantage of summer time changes using the TimeDaylightSavings() function. While it’s still a bit basic, it’s a step in the right direction. //+--------------------------------------------------------------------+ // Summertime determination is reserved for the future calculations //+--------------------------------------------------------------------+ bool Summertime(datetime time) { &nbsp;&nbsp; if(TimeDaylightSavings()!=0) &nbsp;&nbsp;&nbsp;&nbsp;&nbsp;&nbsp;return(true); &nbsp;&nbsp; else &nbsp;&nbsp;&nbsp;&nbsp;&nbsp;&nbsp;return(false); }&nbsp; So, once the clocks spring forward for summer time, all historical data will reflect the time shift. This can be quite handy for keeping your analysis accurate! The first version of this indicator was rolled out on MQL4, paving the way for traders to better navigate the market’s ebb and flow.

2010.03.15
Mastering the Cross Moving Average: Your Guide to Optimizing Trading with MetaTrader 4
MetaTrader4
Mastering the Cross Moving Average: Your Guide to Optimizing Trading with MetaTrader 4

Updated Version. Let’s dive right in! If you’re a fan of the Cross Moving Average and, as a fellow trader, you’re always on the lookout for the simplest solutions, you might have heard that "there's no magic setting for cross MA." This indicator takes a good look at a range of settings every time the time frame, symbol, or even each new candle changes. It operates by analyzing the last 100 candles or so and selects the settings that show the most promise. Essentially, it measures the distance between a short and a long signal, as if anyone were trading this without a stop loss, and it factors in the spread too. 
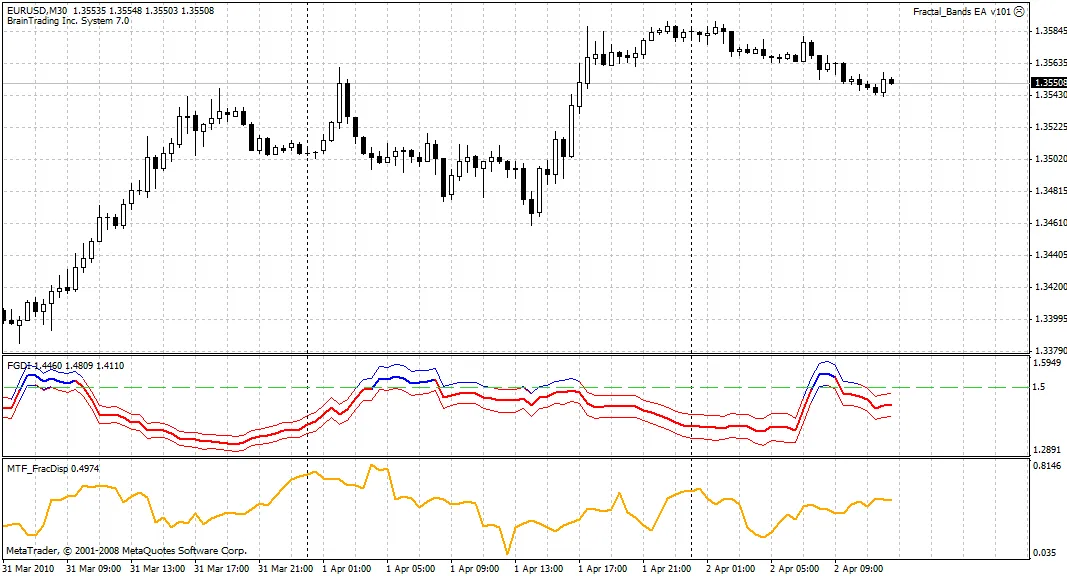
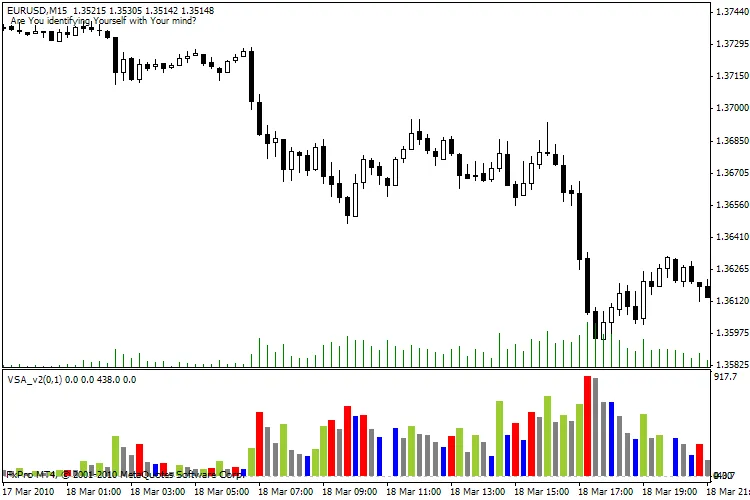
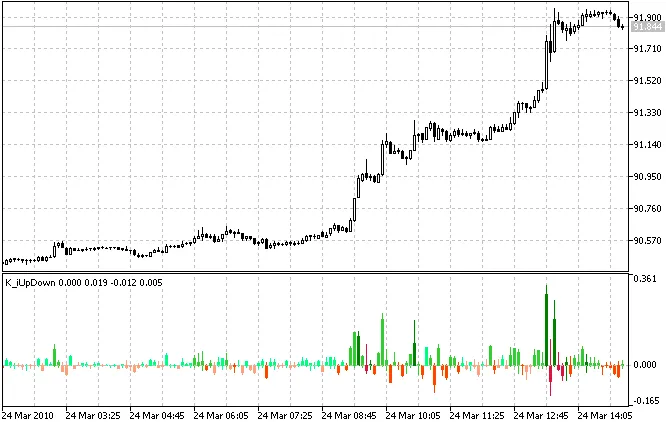
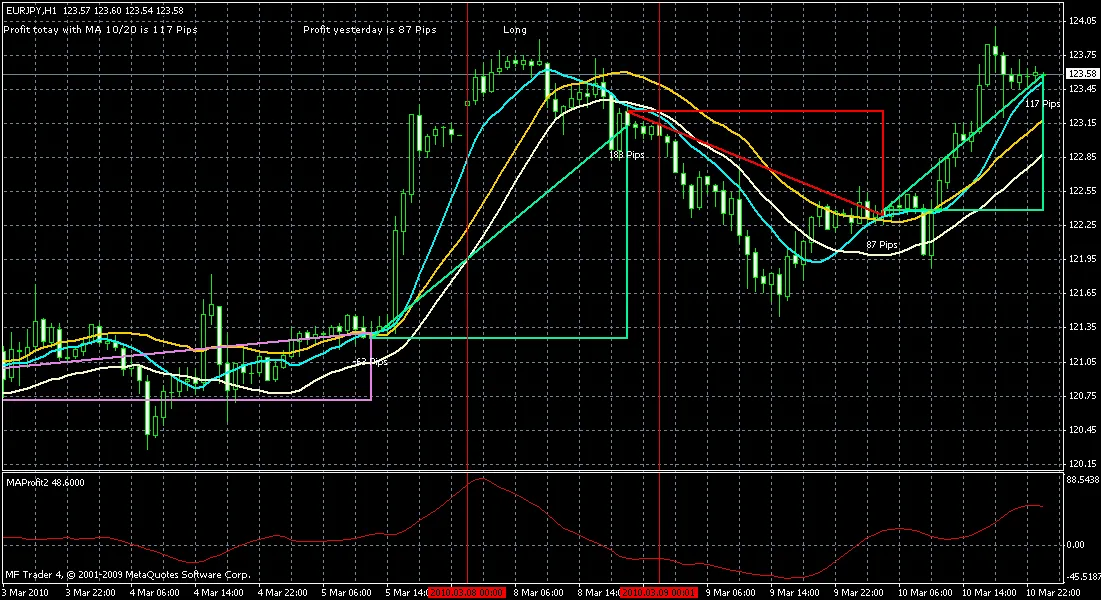
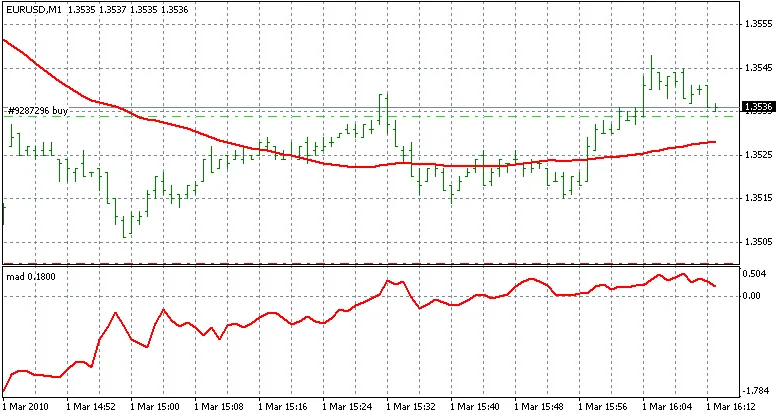
The lower window displays the distance between the short and long Moving Averages; positive values indicate long trades, while negative values signal short trades measured in pips. With the help of the "Profit Oscillator," you can close a trade in profit by checking if the short/long trades have reached a maximum difference and then exiting just before that peak. The upper line indicates "Profit today with MA 5/19 is 60 pips." The indicator, or you as the user, have chosen 5 for the fast MA and 19 for the slow MA. The next field showcases the results from yesterday, followed by a signal to go Long or Short. Many traders find it helpful to overlay two moving averages on their charts and set them to these specified values. I’m continuously exploring various MA recommendations in literature. Parameters PeriodShort=6; Fast MA period. Ignore if optimization is true. PeriodLong=40; Slow MA period. Ignore if optimization is true. Method=0; Method for iMA. Optimize=true; The indicator automatically selects values for the fast and slow MAs.
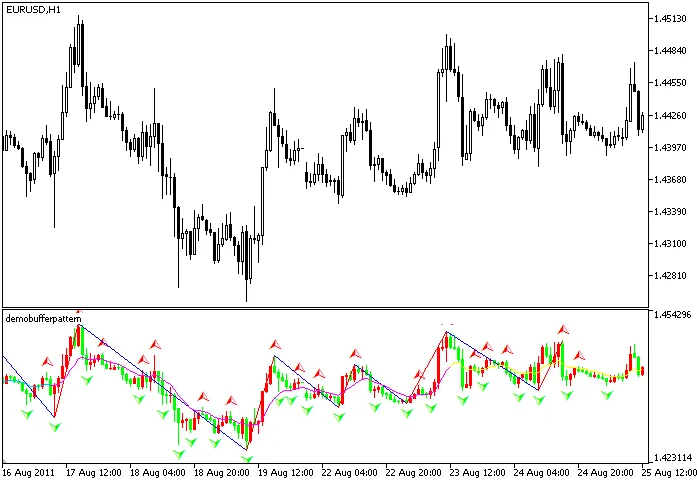
 DrawTriangles=true; Draw triangles on the chart. MinShortMA=2; MaxShortMA=20; MaxLongMA=100; Minimum and maximum values for optimization; it will test values between 2 and 20 for the fast MA and 7 to 100 for the slow MA. StepLongMA=5; StepShortMA=5; To speed up the search, it tests every third value. CountOptimize=200; Analyzes 200 candles from the past. The more candles analyzed, the slower it gets; a bigger number may also yield less reliable results. OptimizeOnNewCandle=false; Start optimization on each new candle. Note: Optimization can take time and may slow down your terminal. Alarm=true; Alerts you when a new signal arises. 
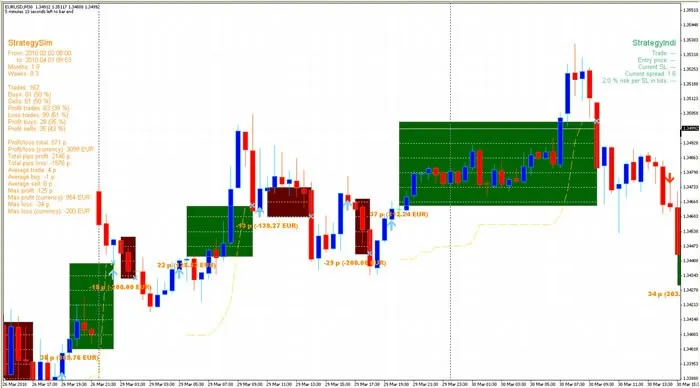
Next on my agenda is to create an Expert Advisor (EA) based on this, but I’m still figuring out how to detect sideways trends, which shouldn’t be traded with the Cross MA. So far, my EA has had its ups and downs; sometimes it makes fantastic gains, only to lose them the next day. New Features 
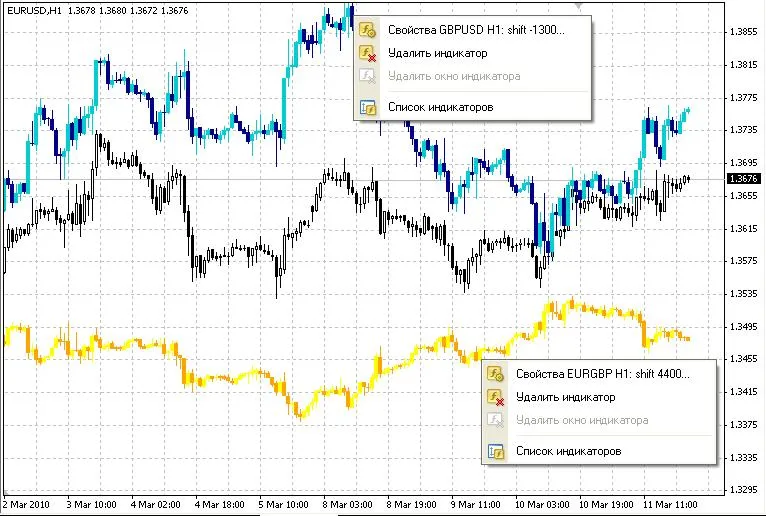
The indicator now draws moving averages directly onto the chart, while the "Profit Oscillator" resides in a different indicator (MAProfit2), and both communicate using global variables. 
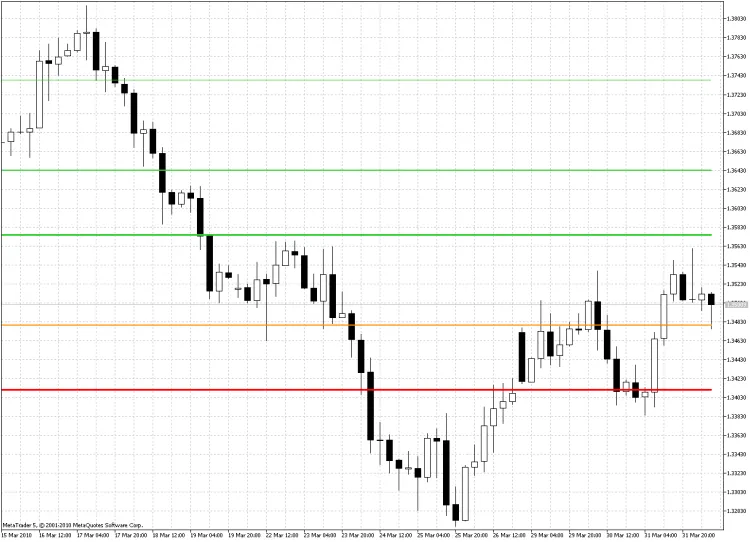
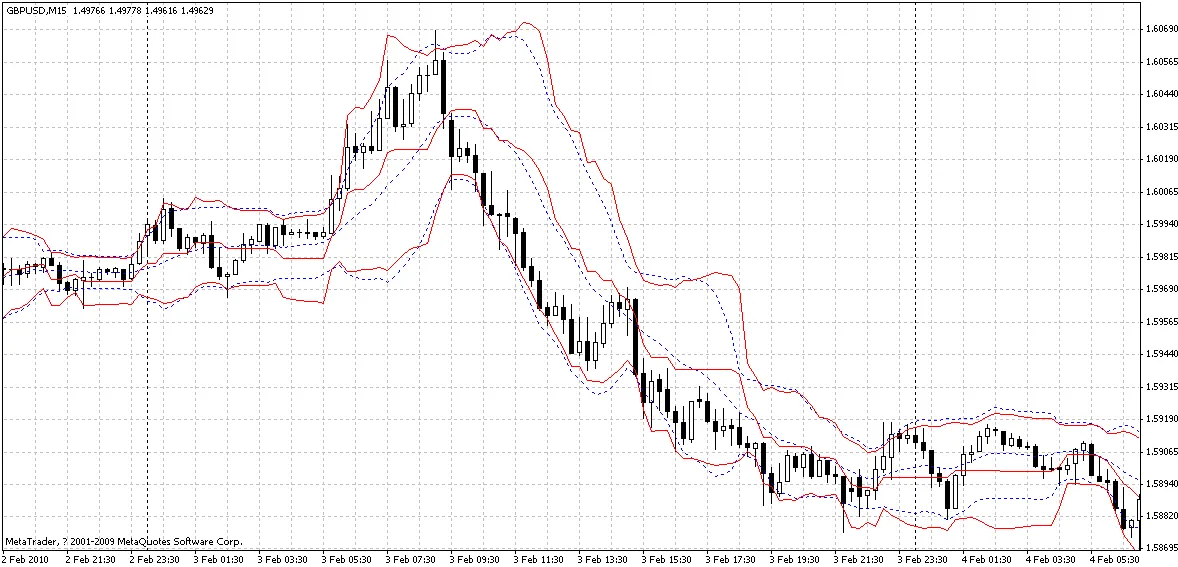
It also supports MA Channels (check out the eBook at www.vnchanger.org). The slow moving average is divided into two lines, one for low and one for high values, helping mitigate losses in sideways markets. 
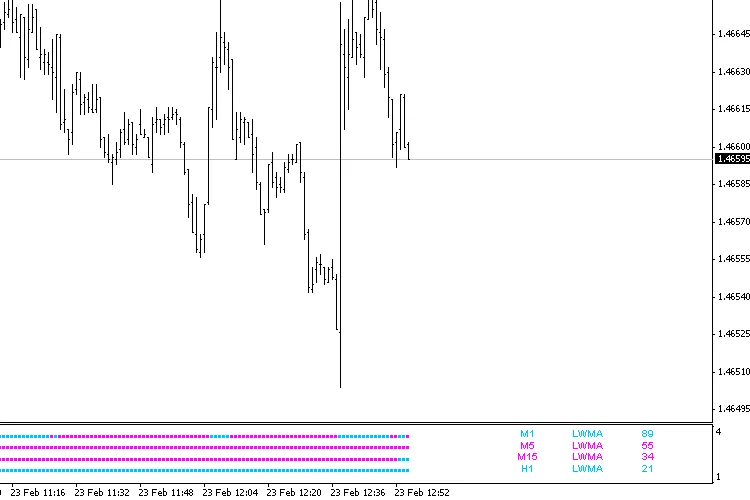
Instead of testing every combination, it can now test specific MA ranges based on literature. To do this, set OptimizeAll to false and OptimizeSystems to true. You can add or modify the systems table, but make sure to terminate it with 0,0,0,0,0,0. extern bool OptimizeAll=false; extern bool OptimizeSystems=true; int Systems[] = {PRICE_MEDIAN,MODE_SMA,50, PRICE_MEDIAN,MODE_SMA,200, PRICE_MEDIAN,MODE_SMA,50, PRICE_MEDIAN,MODE_SMA,100, // Death Cross PRICE_MEDIAN,MODE_SMA,10, PRICE_MEDIAN,MODE_SMA,40, PRICE_MEDIAN,MODE_SMA,13, PRICE_MEDIAN,MODE_SMA,26, PRICE_MEDIAN,MODE_SMA,5, PRICE_MEDIAN,MODE_SMA,10, PRICE_CLOSE, MODE_EMA,5, PRICE_OPEN, MODE_EMA,6, PRICE_MEDIAN,MODE_SMA,3, PRICE_MEDIAN,MODE_SMA,8, 0,0,0,0,0,0}; New alerts can now be set as voice notifications. To use this feature, you’ll need to download gSpeak, which you can find at https://www.mql5.com/en/code/8621. If you’d rather not use voice alerts, you’ll need to modify the code by removing the lines from #import "speak.dll" until #import and uncommenting the gSpeak function. A big shoutout to the author for this fantastic DLL! #import "speak.dll" void gRate(int rate); void gVolume(int rate); void gPitch(int rate); void gSpeak(string text); #import // If you don’t have (or want) the speak.dll, uncomment this /* void gSpeak(string x) { } */ Be warned: If you keep the voice alerts, you might just find yourself loving “Uncle Sam’s” voice after a few profitable trades! On the first run or whenever parameters change, the indicator remembers the candle on the first trade, which helps prevent repainting old trades with new ones. 
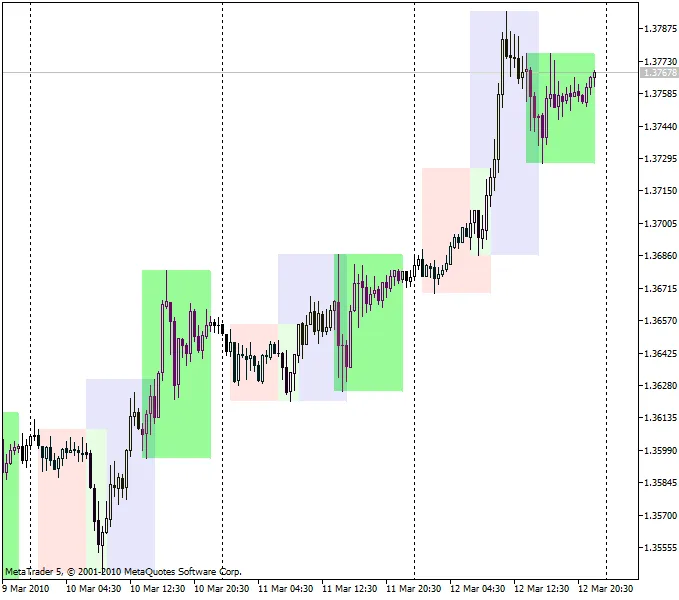
The triangles now come in three colors: Green for long trades, Red for short trades, and Violet for trades that incurred a loss (whether long or short). You can modify the colors in the source code: int ColorLongTrade = MediumSpringGreen; int ColorShortTrade = Red; int ColorBadTrade = Violet; The steps in MA Optimization have been set to 5, and the internal name of this indicator has been changed to SMA (Smart Ass ... it shows how you should have traded afterward). MA Optimizer

2010.03.03
Unlocking the MAD Indicator: Your Guide to the Moving Average Delta in MetaTrader 4
MetaTrader4
Unlocking the MAD Indicator: Your Guide to the Moving Average Delta in MetaTrader 4

Description: The MAD, or Moving Average Delta, is a unique indicator designed to help traders visualize the differences between two points of a moving average. By plotting this difference in pips on a curve, it provides insights that might otherwise go unnoticed. Imagine looking at a simple moving average curve under a microscope; that's the kind of clarity the MAD gives you. This tool can be instrumental in predicting potential trend changes before they occur. For instance, it can signal a shift from bullish to bearish trends. Despite being a straightforward indicator, I still have a soft spot for moving averages. They reflect market behavior, which tends to shift gradually. When a trend shifts, it’s like a wave; it starts with a few traders making moves, which eventually snowballs into a larger market shift. As the curve starts to flatten, it hints at a potential reversal. (I’m honestly surprised this type of indicator hasn’t been more widely utilized!) Image: The MAD indicator Interpretation: If the MAD curve is above 0, it indicates that the moving average is trending upwards. As a trend change approaches, the moving average will flatten out, and the MAD curve will trend toward zero. This indicator helps you gauge the maximum rise or fall of the moving average, allowing you to anticipate upcoming trend shifts. Usage: To get started, add a simple moving average (SMA) to your chart and adjust the period to best fit the price movements. There’s no one-size-fits-all setting for the SMA; feel free to double-click the MA line to modify the period as needed. Next, apply the MAD indicator to your chart, ensuring it matches the period of your SMA for optimal results.

2010.03.02
First Previous 337 338 339 340 341 342 343 344 345 346 347 Next Last