Description:
The Higher Timeframe Trend Indicator is your go-to tool for gauging the overall trend on a higher timeframe while you’re trading on a lower timeframe. Here’s how it works:
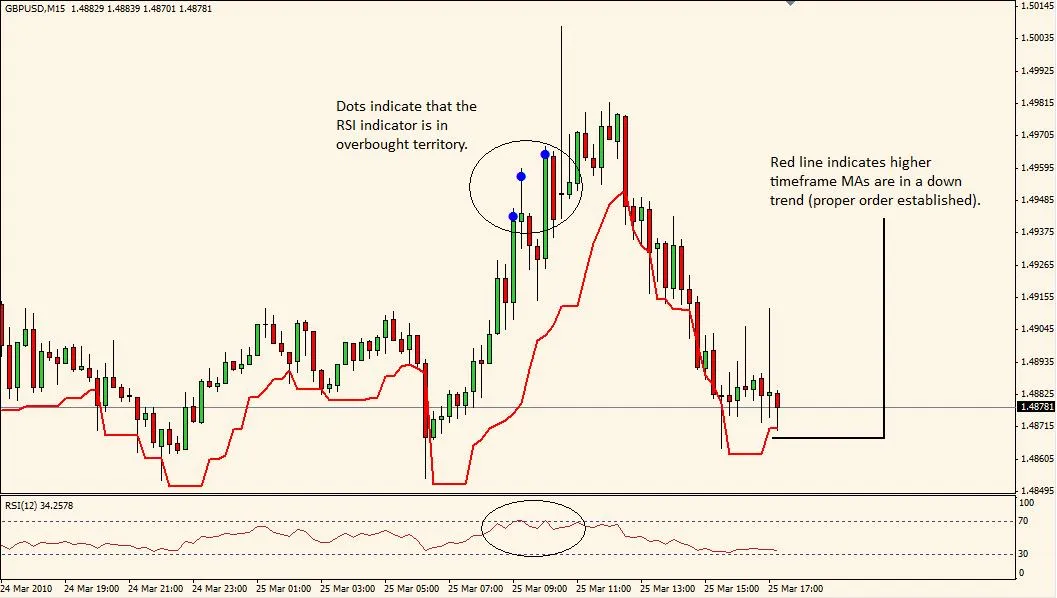
- If the moving averages (MA) are aligned as follows: MA_1 < MA_2 < MA_3 < MA_4 on the higher timeframe, it signals that a downtrend is in motion. On your current chart, you’ll see a red line indicating this trend. This red line is derived from the Price Channel Index (PCI) and can serve as a support level. If you have the built-in RSI indicator turned on, you’ll get an alert when the RSI enters overbought territory, hinting at a potential reversal. It’s a solid strategy to enter trades when the price closes below this red PCI support line.
- Conversely, if the moving averages are in the order of MA_1 > MA_2 > MA_3 > MA_4, that indicates an uptrend. You’ll notice a green line on your chart that represents this uptrend. The green line also comes from the PCI and acts as a resistance line. Again, with the RSI enabled, you’ll receive an alert when the RSI dips into oversold territory, suggesting a possible trend reversal. A good entry point would be when the price closes above the green PCI resistance line.
- A grey line indicates that there’s no significant trend on the higher timeframe.
For optimal performance, I recommend the following timeframe combinations:
- Higher Timeframe: Daily Current Timeframe: 1hr
- Higher Timeframe: 4hr Current Timeframe: 15min
- Higher Timeframe: 1hr Current Timeframe: 5min
- Higher Timeframe: 5/15min Current Timeframe: 1min
Image:
Properties:
extern int Upper_Timeframe = 240;      // Upper timeframe in minutes (e.g., 240 = 4hr)
extern int Upper_Timeframe_MA_1 = 10;  // MA_1 must be the fastest MA
extern int Upper_Timeframe_MA_2 = 20;
extern int Upper_Timeframe_MA_3 = 50;
extern int Upper_Timeframe_MA_4 = 100; // MA_4 must be the slowest MA
extern bool RSI_Check_On = true;       // Checks for RSI OverBought/OverSold conditions
extern bool RSI_Alert_On = true;       // Audio alert for RSI OverBought/OverSold conditions
extern int RSI_Period = 12;            // RSI period
extern int Upper_RSI_Limit = 70;       // Upper limit indicating overbought conditions
extern int Lower_RSI_Limit = 30;       // Lower limit indicating oversold conditions
extern int PCI_Period = 5;             // PCI period; e.g., 5 sets support line in a downtrend to the lowest low from the past 5 bars
extern int PCI_Shift = 1;              // PCI Shift, best set to 1
extern double Entry_Buffer = 0.0002;   // Increases width of PCI channel by specified pips, i.e., lowers support line in a downtrend
extern color Dot_Color = Blue;
Related Posts
- Unlocking MetaCOT 2: Your Ultimate CFTC Indicator Toolkit for MT4
- Unlocking the Power of Master Tools for MetaTrader 4
- Unlock Trading Insights with Volume Profile + Range v6.0 for MetaTrader 5
- Mastering the Fibonacci ZigZag Indicator for MetaTrader 5
- Visualize Current Trends Across All Time Frames with This MetaTrader 4 Indicator