
Overview:
The Market Way indicator might not be the newest tool in the trader's toolkit, but it certainly has its merits. While the concept isn't groundbreaking, it plays a crucial role in helping us understand market movements.
This indicator provides a summary of the difference between opening and closing prices over a specific timeframe, focusing on key trends:
- It calculates only bearish bars;
- It calculates only bullish bars;
- It includes a weighted average for the entire period.
Benefits:
- Combines the features of an oscillator and a trend indicator (a significant advantage!).
- Easy to understand and interpret.
- Identifies good points for upward or downward movement.
- Indicates bullish or bearish pressure and estimates movement, which is crucial for setting stop-loss and take-profit levels.
- Shows the presence and strength of lateral movement (high or low volatility).
- Highlights overbought and oversold levels.
- Clearly depicts price movement waves and can signal divergence/convergence levels.
- Helps forecast future price behavior and is effective for market entry using this indicator alone (very important!).
- Works well across all timeframes and can be applied to markets beyond forex.
- Filters out false signals without additional smoothing, maintaining fidelity with the same period SMA.
Drawbacks:
- Requires a settlement period, which can decrease the accuracy of the analyzed data sample size (a common issue with many indicators).
- Not all capabilities of this indicator have been thoroughly explored.
Recommended Parameters:
extern int IdBull = 12; // Bullish line value, ideally equal to the bear and main line.
extern int IdBear = 12; // Bearish line value, ideally equal to the bull line and main line.
extern int IdArray = 12; // Smoothing value for all lines on the graph, known as SIGNAL lines.
On display, a histogram represents the difference between the bullish line (white bars) and SMA alongside the bearish line (black bars) and its SMA. More detailed information can be found within the indicator's code. Recommended settings are multiples of 12, including numbers divisible by 3 and 4, with a maximum of 108 and a minimum of 12, possibly down to 9 or 7. These recommendations are based on other studies, so treat them as guidelines.
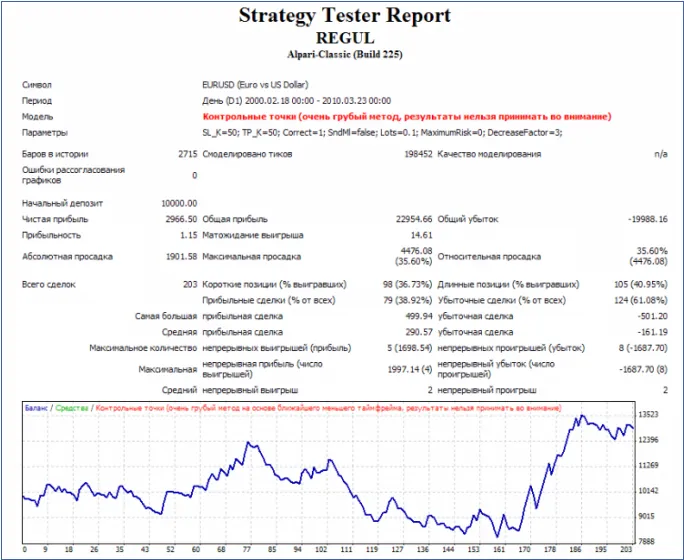
This Indicator in Strategy Testing:
These setups are not optimized, and trades are executed at the opening of a bar, so there’s no need to test every tick—just open one trade per bar. Timeframe: Daily, Tool: EURUSD, period: All available from 1999 to 2010. Stop Loss and Take Profit are set at 500 points. Exit conditions are based on the opposite transaction entry.
Conditions for Long Entry:
&& BullPressure1 - Point > 0 // Bullish pressure must be above 0
&& BearPressure1 - Point > 0 // Bearish pressure must be above 0
&& MainAccumulation1 - Point > 0 // Main line should be above 0
Conditions for Short Entry:
&& BullPressure1 - Point < 0 // Bullish pressure must be below 0
&& BearPressure1 - Point < 0 // Bearish pressure must be below 0
&& MainAccumulation1 - Point < 0 // Main line should be below 0
Ensure that exit conditions are strictly the opposite.
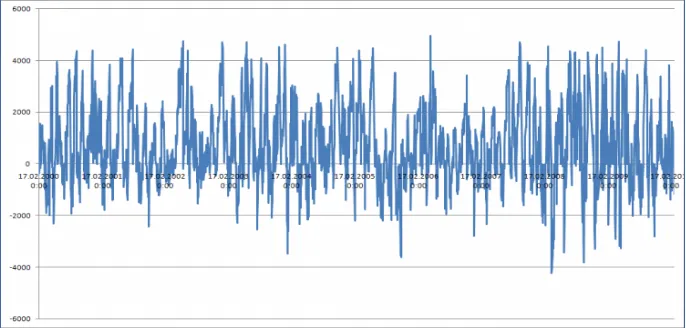
The following graph displays asset changes (Equity), with a precision of 5 digits. As you can see, after opening any trades, equity rarely drops below -200 points.
Related Posts
- Unlocking MetaCOT 2: Your Ultimate CFTC Indicator Toolkit for MT4
- Visualize Current Trends Across All Time Frames with This MetaTrader 4 Indicator
- Unlocking the Power of Master Tools for MetaTrader 4
- Unlock Trading Insights with Volume Profile + Range v6.0 for MetaTrader 5
- Mastering the FE Fibonacci Expansion Indicator for MetaTrader 4