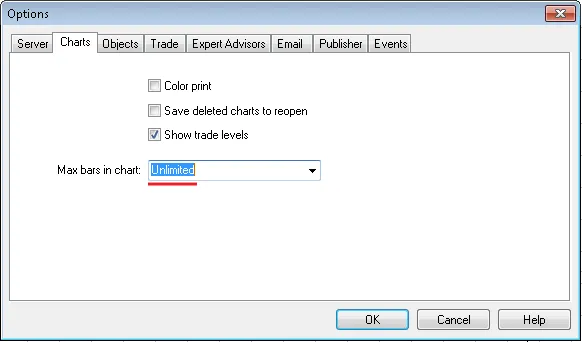
Technical Indicator

Mastering the Setka Indicator for MetaTrader 5: A Trader's Guide
MetaTrader5
Mastering the Setka Indicator for MetaTrader 5: A Trader's Guide

If you're looking to enhance your trading experience with MetaTrader 5, the Setka (grid) indicator is a great tool to have in your arsenal. This nifty indicator helps you quickly pinpoint the start and end times of the day, week, or month, and lets you track the highest and lowest prices during these periods. It also provides insights into price movements and highlights important levels and market events like news announcements. I highly recommend giving this indicator a shot; it could be a game changer for your trading routine. Thanks to the MQL5 Language, you can utilize functions that were previously unavailable in MQL4 (check out this link for more details). By default, the Setka indicator comes with these parameters: //--- input parameters input int   Step=250;         // vertical grid step in points input int   Figure=1000;      // figure step Sometimes, you’ll want to tweak these settings for specific symbols. You can easily adjust the input variables in the program code to create your own color scheme: // color of vertical lines color new_hour=DimGray;       // new hour color new_day =Blue;         // new day color new_week=DeepPink;      // new week color new_mon =Yellow;        // new month // color of horizontal lines color new_Hfigure=RoyalBlue;  // new figure color new_Hline=DimGray;      // new line Feel free to customize your color scheme by modifying these variables. If you find this indicator useful, here are some tips to get you started: Disable the standard grid. Adjust the number of bars in history by going to Service → Settings: Restart your client terminal. Open the chart and attach the Setka indicator. You should see it displayed like this: Select all the created objects and delete them. Right-click to save the template (Templates → Save Template) under the name Default.tpl. By doing this, your grid will automatically launch whenever you open or change any chart. All the relevant time and information will be logged as follows: 2010.06.15 11:53:16         Setka (AUDUSD,M15)          Failure or first call Time= 1.4 sec for  50000  bars  ObjectsTotal= 12718  MaxBars= 0  If you want to speed up the grid startup time (and you don’t need the grid for all history), set MaxBars=2000 before saving the template. During flat market conditions or if you encounter issues (you’ll know when you see them), refresh the chart by clicking "Refresh" to recalculate the indicator. A big shoutout to Renat for their invaluable help in creating the indicator and providing examples. You can check out more in this forum thread.

2010.05.18
Mastering the Wavy Dash Indicator for MT4: Your Trading Companion
MetaTrader4
Mastering the Wavy Dash Indicator for MT4: Your Trading Companion

Author: http://pipswanted.com 
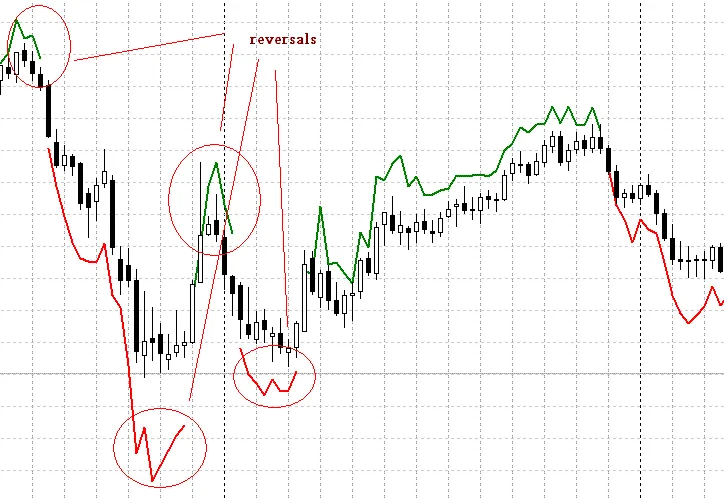
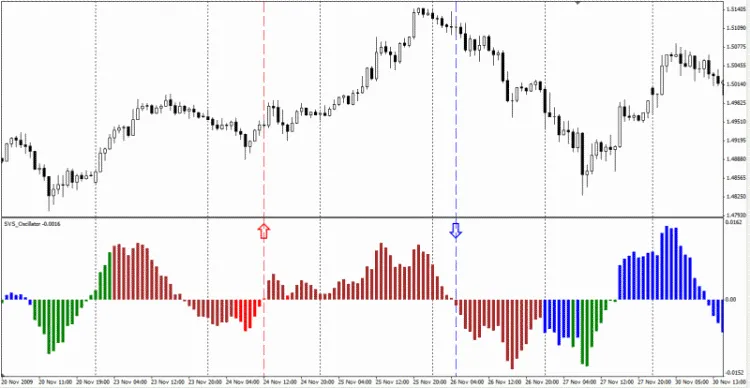
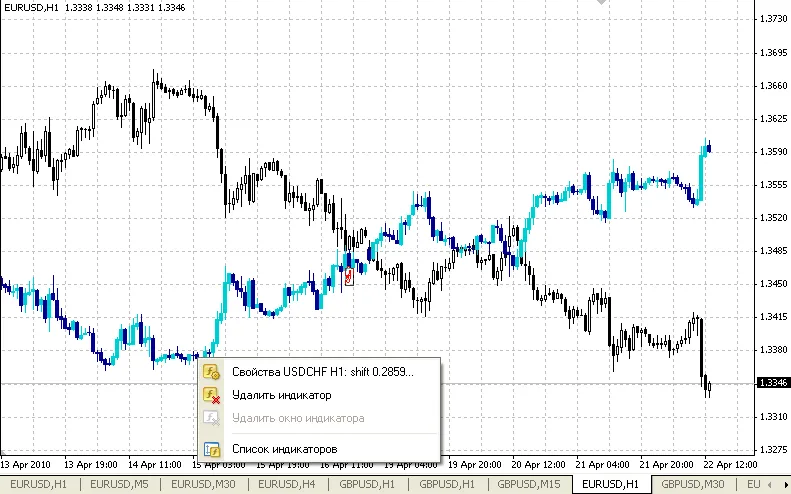
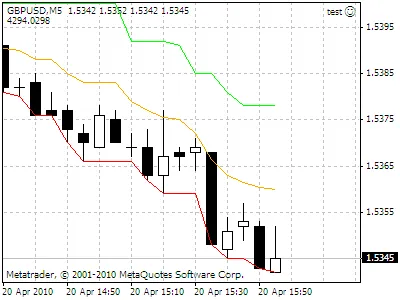
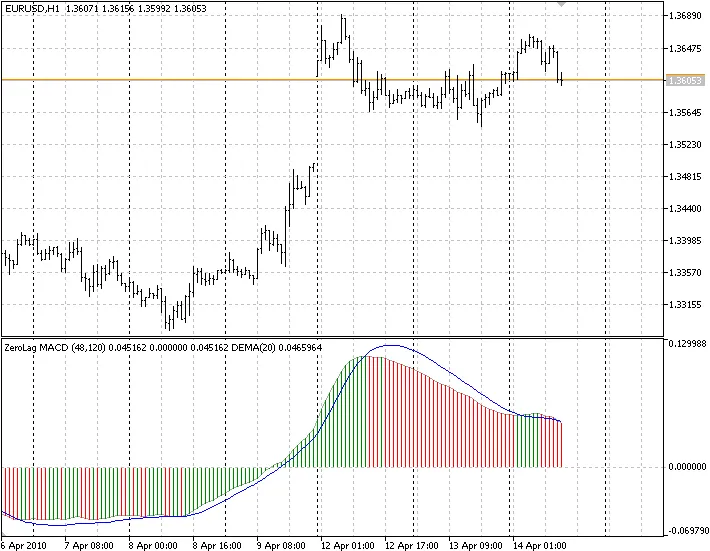
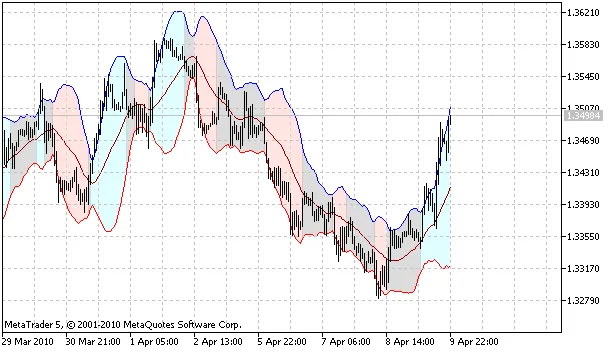
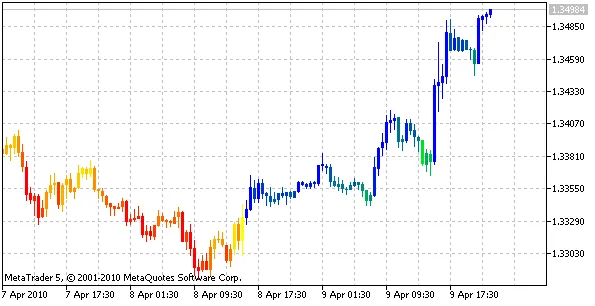
The Wavy Dash Indicator is a powerful tool for traders using MetaTrader 4. It employs the Gann method, providing clear signals for your trading strategy. When the indicator displays green lines, it's time to buy, while red lines signal a sell. It’s straightforward and effective! Indicator Code: for(int i=Bars-Back;i>=0;i--) {       if(Close[i]>iMA(Symbol(),0,Back,0,MODE_SMA,PRICE_HIGH,i))       {          one=1;      }         else       {          if(Close[i]<iMA(Symbol(),0,Back,0,MODE_SMA,PRICE_LOW,i))             one=-1;          else             one=0;       }       if(one!=0)       {          two=one;       }         if(two==-1)       {          double a = iMA(Symbol(),0,Back,0,MODE_EMA,PRICE_HIGH,i+1) - iClose(Symbol(), 0 ,i+2);          red[i] = (iClose(Symbol(), 0 ,i) - a);       }       else       {          double b = iClose(Symbol(), 0 ,i+2) - iMA(Symbol(),0,Back,0,MODE_EMA,PRICE_LOW,i+1);          green[i] = (iClose(Symbol(), 0 ,i) + b);       } } For more insights and information, check out: http://pipswanted.com If you have any questions or need help with trading, feel free to ask here: http://tradersqa.com

2010.05.16
Unlocking Trading Success: 16 Essential Indicators for MetaTrader 4
MetaTrader4
Unlocking Trading Success: 16 Essential Indicators for MetaTrader 4

Author: Damien Visit my blog for more insights! 1. Price Indicator This powerful tool is composed of candles and comes equipped with: Parabolic SAR Bollinger Bands 4 Moving Averages You have the flexibility to activate or deactivate each indicator using a simple true/false option. For the moving averages, you’ll need to specify your preferences in uppercase. Here are the options you can choose from: CLOSE HIGH LOW OPEN TYPICAL MEDIAN WEIGHTED When selecting the moving average style, also note your preferences in uppercase: EMA SMA SMOOTH LWMA Indicators in a Separate Window CCI (Commodity Channel Index) RSI (Relative Strength Index) Standard Deviation (STDEV) MACD (Moving Average Convergence Divergence) Stochastic (STO) Bull (BULL) Bear (BEAR) On-Balance Volume (OBV) Momentum (MOM) Awesome Oscillator (AO) Accumulation/Distribution (AC) Money Flow Index (MFI) Average True Range (ATR) OSMA (Moving Average of Oscillator) ADX (Average Directional Index) Force Index (FORCE) You can choose the type of price used for calculating the indicators and the type of moving averages, just like with the price indicator. Your preferences should be noted in the same manner. Additionally, you can select the style of the indicator under the "style" section, where three options are available. Make sure to specify your choice in uppercase: HISTOGRAM = HISTO LINE = LINE DOT = POINT If my explanations seem a bit unclear, I apologize—this is an automatic translation, and I’m doing my best to share my knowledge with you! Happy testing and successful trading! :)

2010.05.05
Mastering Pivot Points: Your Guide to the PivotPointUniversal Indicator for MetaTrader 5
MetaTrader5
Mastering Pivot Points: Your Guide to the PivotPointUniversal Indicator for MetaTrader 5

If you're looking to enhance your trading strategy, the PivotPointUniversal indicator for MetaTrader 5 is definitely worth considering. This handy tool plots Pivot levels across all available historical data without relying on any objects, making it a straightforward addition to your trading toolkit. Understanding Pivot Levels This indicator supports five different types of Pivot levels and three calculation periods: daily, weekly, and monthly. For daily Pivot levels, you can even adjust the GMT time shift to match your trading needs. Pivot Calculation Formulas Here’s a quick overview of the formulas used for calculating the various Pivot levels: Classic Pivot PIVOT_CLASSIC Pivot (P) = (H + L + C) / 3Resistance (R1) = (2 * P) - LSupport (S1) = (2 * P) - HR2 = P + H - LS2 = P - H + LR3 = H + 2 * (P - L)S3 = L - 2 * (H - P) Fibonacci Pivot PIVOT_FIBONACCI Pivot (P) = (H + L + C) / 3Resistance (R1) = P + 0.382(H – L)Support (S1) = P – 0.382(H – L)R2 = P + 0.618*(H – L)S2 = P – 0.618*(H – L)R3 = H + 1*(H – L)S3 = L - (H – L) Demark Pivot PIVOT_DEMARK If C < O, then X = H + 2 * L + C;If C > O, then X = 2 * H + L + C;If C = O, then X = H + L + 2 * C;Resistance (R1) = X / 2 - L;Support (S1) = X / 2 - H Camarilla Pivot PIVOT_CAMARILLA R4 = (H - L) * 1.1 / 2 + CR3 = (H - L) * 1.1 / 4 + CR2 = (H - L) * 1.1 / 6 + CR1 = (H - L) * 1.1 / 12 + CS1 = C - (H - L) * 1.1 / 12S2 = C - (H - L) * 1.1 / 6S3 = C - (H - L) * 1.1 / 4S4 = C - (H - L) * 1.1 / 2 Woodies Pivot PIVOT_WOODIES Pivot (P) = (H + L + 2 * C) / 4Resistance (R1) = (2 * P) - LSupport (S1) = (2 * P) - HR2 = P + H - LS2 = P - H + L The image above showcases four indicators of PIVOT_CLASSIC with different parameters. Remember, the first parameter (GMT shift) applies only to daily Pivots. If you spot any errors or have questions, feel free to reach out on our Forum, and we'll make sure to address them. Happy trading!

2010.04.26
Order Closing Alerts for MetaTrader 4: Maximize Your Trading Profits
MetaTrader4
Order Closing Alerts for MetaTrader 4: Maximize Your Trading Profits

Description: If you're looking to enhance your trading experience on MetaTrader 4, this handy indicator is a must-have. The Order Closing Alert indicator not only notifies you when your trades close but also provides insights into your profits. Stay informed and make better decisions with every trade! //+------------------------------------------------------------------+ //|&nbsp;&nbsp;&nbsp;&nbsp;&nbsp;&nbsp;&nbsp;&nbsp;&nbsp;&nbsp;&nbsp;&nbsp;&nbsp;&nbsp;&nbsp;&nbsp;&nbsp;&nbsp;&nbsp;&nbsp;&nbsp;&nbsp;&nbsp;&nbsp;&nbsp;&nbsp;&nbsp;&nbsp;&nbsp;&nbsp;&nbsp;&nbsp;&nbsp;&nbsp;&nbsp;&nbsp;&nbsp;&nbsp;&nbsp;&nbsp;&nbsp;&nbsp;&nbsp;&nbsp;&nbsp;&nbsp;AlertCloseOrder.mq4 | //|&nbsp;&nbsp;&nbsp;&nbsp;&nbsp;&nbsp;&nbsp;&nbsp;&nbsp;&nbsp;&nbsp;&nbsp;&nbsp;&nbsp;&nbsp;&nbsp;&nbsp;&nbsp;&nbsp;&nbsp;&nbsp;&nbsp;&nbsp;&nbsp;&nbsp;&nbsp;&nbsp;&nbsp;&nbsp;&nbsp; Copyright © 2010, Vladimir Hlystov | //|&nbsp;&nbsp;&nbsp;&nbsp;&nbsp;&nbsp;&nbsp;&nbsp;&nbsp;&nbsp;&nbsp;&nbsp;&nbsp;&nbsp;&nbsp;&nbsp;&nbsp;&nbsp;&nbsp;&nbsp;&nbsp;&nbsp;&nbsp;&nbsp;&nbsp;&nbsp;&nbsp;&nbsp;&nbsp;&nbsp;&nbsp;&nbsp;&nbsp;&nbsp;&nbsp;&nbsp;&nbsp;&nbsp;&nbsp;&nbsp; http://cmillion.narod.ru | //+------------------------------------------------------------------+ #property copyright "Copyright © 2010, Vladimir Hlystov" #property link&nbsp;&nbsp;&nbsp;&nbsp;&nbsp;&nbsp;"http://cmillion.narod.ru" #property indicator_chart_window int Orders; //+------------------------------------------------------------------+ int start() &nbsp;&nbsp;{ &nbsp;&nbsp; if (Orders&gt;OrdersTotal()) AlertOrder(); &nbsp;&nbsp; Orders=OrdersTotal(); &nbsp;&nbsp; return(0); &nbsp;&nbsp;} //+------------------------------------------------------------------+ void AlertOrder() { &nbsp;&nbsp; string txt; &nbsp;&nbsp; double OCP; &nbsp;&nbsp; int i=OrdersHistoryTotal()-1; &nbsp;&nbsp; if(OrderSelect(i,SELECT_BY_POS,MODE_HISTORY)==true) &nbsp;&nbsp; {&nbsp;&nbsp;&nbsp;&nbsp;&nbsp;&nbsp;&nbsp;&nbsp;&nbsp;&nbsp;&nbsp;&nbsp;&nbsp;&nbsp;&nbsp;&nbsp;&nbsp;&nbsp;&nbsp;&nbsp;&nbsp;&nbsp;&nbsp;&nbsp;&nbsp;&nbsp;&nbsp;&nbsp;&nbsp;&nbsp;&nbsp;&nbsp;&nbsp;&nbsp;&nbsp;&nbsp; &nbsp;&nbsp;&nbsp;&nbsp;&nbsp;&nbsp;OCP=OrderClosePrice(); &nbsp;&nbsp;&nbsp;&nbsp;&nbsp;&nbsp;if (OCP==OrderStopLoss()&nbsp;&nbsp;) txt="SL"; &nbsp;&nbsp;&nbsp;&nbsp;&nbsp;&nbsp;if (OCP==OrderTakeProfit()) txt="TP"; &nbsp;&nbsp;&nbsp;&nbsp;&nbsp;&nbsp;Alert("Order N ",OrderTicket()," close in ",txt," ", &nbsp;&nbsp;&nbsp;&nbsp;&nbsp;&nbsp;DoubleToStr(OCP,Digits)," profit ",DoubleToStr(OrderProfit(),2)); }&nbsp;&nbsp;} //+------------------------------------------------------------------+

2010.04.26
Mastering Murrey Math Lines: Your Ultimate Guide to Support and Resistance
MetaTrader5
Mastering Murrey Math Lines: Your Ultimate Guide to Support and Resistance

Authored by: This indicator is rooted in the innovative algorithm introduced by Vladislav Goshkov (VG) 4vg@mail.ru. The Murrey Math Lines (MML) indicator displays historical price levels without the need for additional objects. According to Gann theory, prices fluctuate in 1/8 increments, which serve as vital support and resistance points as an asset's price evolves over time. By leveraging this 1/8 characteristic of price action, Murrey assigns specific attributes to each of the MMLs within a given octave. Here’s a breakdown of these properties: 8/8 and 0/8 Lines (Ultimate Resistance): These lines are formidable barriers on the upward trajectory and offer robust support when prices decline. It’s not uncommon for prices to struggle to breach these lines. 7/8 Line (Weak, Stall, and Reverse): This line is considered weak. If prices surge too quickly and stall here, they often reverse sharply. Should they bypass this line without stalling, they are likely to climb toward the 8/8 line. 6/8 and 2/8 Lines (Pivot, Reverse): These lines are nearly as influential as the 4/8 line in reversing price trends, whether the market is moving up or down. 5/8 Line (Top of Trading Range): Prices typically hover between the 5/8 and 3/8 lines for about 40% of the time. If prices break above the 5/8 line and maintain that position for 10 to 12 days, it indicates a premium pricing situation. Conversely, if prices drop below this line, they often seek support at lower levels. 4/8 Line (Major Support/Resistance): This line represents the strongest point of support and resistance. It provides the most significant backing when prices are above it and the most substantial resistance when below. It’s an ideal level for traders to consider buying or selling. 3/8 Line (Bottom of Trading Range): If prices are below this line and moving upwards, it poses a challenge to breach. Successfully closing above this line for 10 to 12 days indicates that prices will likely remain above it, spending 40% of the time oscillating between this line and the 5/8 line. 1/8 Line (Weak, Stall, and Reverse): Similar to the 7/8 line, this is a weak point. Prices that drop rapidly and stall at this line often reverse upwards. If they don’t stall, they may continue down to the 0/8 line. If you spot any inaccuracies or errors, feel free to share them in our Forum!

2010.04.20
Understanding the 'Three Indians' Pattern in MetaTrader 4
MetaTrader4
Understanding the 'Three Indians' Pattern in MetaTrader 4

Let's dive into the 'Three Indians' pattern, a fascinating indicator based on the ZigZag tool. About the System: While I won't go into a detailed description of the system here—it's quite easy to find online—I do want to highlight the importance of market context. The term 'Three Indians' is a direct translation from Russian; if you know a different name in English, feel free to drop it in the comments! Just a quick reminder: this pattern should always be viewed in relation to the current market situation. It’s not a standalone trading signal. Two Main Trading Approaches: Trend Trading: This is the safer approach, where the pattern serves as a signal for the continuation of an established trend after a correction. Check out the chart below for a visual representation: Counter-Trend Trading: This method is riskier and suggests a significant trend reversal. In this case, the waves of the pattern should be noticeably larger compared to the trend or its last wave: Options: The beginnings and middles of the lines align with the first and second prospective 'Indians' respectively. Here are some settings you might find useful: extern int ExtDepth=10; // ZigZag options extern int ExtDeviation=5; extern int ExtBackstep=3; extern double K_MinWave=0.6; // Minimum size of a wave from the 1st Indian relative to the 2nd, to filter out small waves extern int Depth=3; // Depth of search for the 1st Indian, accounting for the filter, but no more than 10! And don’t forget to customize your line history, colors, and thickness! Final Thoughts: Understanding the 'Three Indians' pattern can enhance your trading strategy, whether you’re riding the trend or looking to catch reversals. Remember, always keep an eye on market conditions!

2010.04.19
First Previous 336 337 338 339 340 341 342 343 344 345 346 Next Last