Authored by:
This indicator is rooted in the innovative algorithm introduced by Vladislav Goshkov (VG) 4vg@mail.ru.
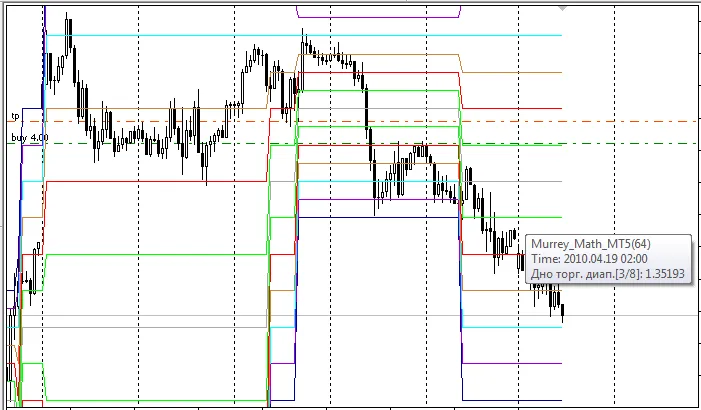
The Murrey Math Lines (MML) indicator displays historical price levels without the need for additional objects. According to Gann theory, prices fluctuate in 1/8 increments, which serve as vital support and resistance points as an asset's price evolves over time. By leveraging this 1/8 characteristic of price action, Murrey assigns specific attributes to each of the MMLs within a given octave. Here’s a breakdown of these properties:
- 8/8 and 0/8 Lines (Ultimate Resistance): These lines are formidable barriers on the upward trajectory and offer robust support when prices decline. It’s not uncommon for prices to struggle to breach these lines.
- 7/8 Line (Weak, Stall, and Reverse): This line is considered weak. If prices surge too quickly and stall here, they often reverse sharply. Should they bypass this line without stalling, they are likely to climb toward the 8/8 line.
- 6/8 and 2/8 Lines (Pivot, Reverse): These lines are nearly as influential as the 4/8 line in reversing price trends, whether the market is moving up or down.
- 5/8 Line (Top of Trading Range): Prices typically hover between the 5/8 and 3/8 lines for about 40% of the time. If prices break above the 5/8 line and maintain that position for 10 to 12 days, it indicates a premium pricing situation. Conversely, if prices drop below this line, they often seek support at lower levels.
- 4/8 Line (Major Support/Resistance): This line represents the strongest point of support and resistance. It provides the most significant backing when prices are above it and the most substantial resistance when below. It’s an ideal level for traders to consider buying or selling.
- 3/8 Line (Bottom of Trading Range): If prices are below this line and moving upwards, it poses a challenge to breach. Successfully closing above this line for 10 to 12 days indicates that prices will likely remain above it, spending 40% of the time oscillating between this line and the 5/8 line.
- 1/8 Line (Weak, Stall, and Reverse): Similar to the 7/8 line, this is a weak point. Prices that drop rapidly and stall at this line often reverse upwards. If they don’t stall, they may continue down to the 0/8 line.
If you spot any inaccuracies or errors, feel free to share them in our Forum!
Related Posts
- Unlocking the Power of Master Tools for MetaTrader 4
- Unlocking MetaCOT 2: Your Ultimate CFTC Indicator Toolkit for MT4
- Mastering Support and Resistance: Essential Indicator for MetaTrader 4
- Mastering the Open Range Breakout Indicator for MetaTrader 5
- Visualize Current Trends Across All Time Frames with This MetaTrader 4 Indicator