If you’re diving into trading, you’ve probably come across the Hurst exponent. This nifty indicator is based on the idea that price variations can be modeled using a multi-fractal approach. Basically, the Hurst exponent (H) can be calculated from the fractal dimension, which you can find detailed in the MQL4 codebase.
Now, here’s where it gets interesting: the fluctuations in the Hurst exponent can actually help us predict volatility changes. When you see a positive variation, that’s a good signal to jump into a trade. It’s all about riding the waves during those high volatility periods to make a profit!
However, a quick word of caution: while the Hurst exponent gives you a heads-up on volatility, it doesn’t point you in the direction of the trade. For that, you’ll need to pair it with a directional indicator.
If you’re eager for more insights on this indicator, check out my blog post here: Hurst Exponent Insights.
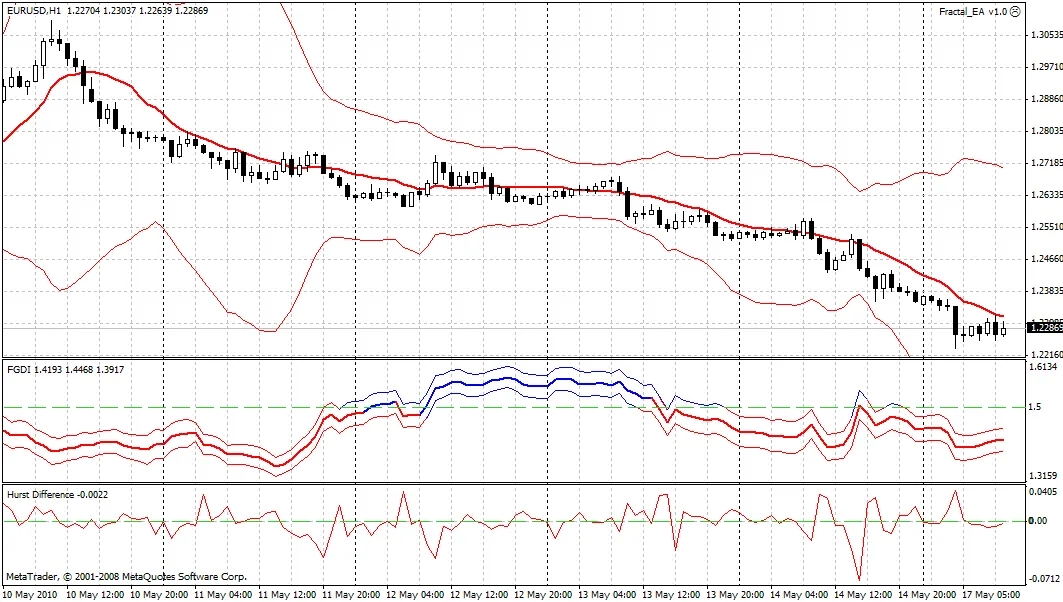
Curious to see how it looks in action? Here’s an example from a 1-hour EUR/USD chart:
Related Posts
- Unlocking MetaCOT 2: Your Ultimate CFTC Indicator Toolkit for MT4
- Unlocking the Power of Master Tools for MetaTrader 4
- Visualize Current Trends Across All Time Frames with This MetaTrader 4 Indicator
- Unlock Trading Insights with Volume Profile + Range v6.0 for MetaTrader 5
- Mastering the MACD Candle Indicator for MetaTrader 4