MetaTrader5
Unlocking Trading Success with QQE and QQE MTF Indicators for MetaTrader 5
Real Author:
traderak20, based on QQE.mq5 by EarnForex Copyright © 2010, with contributions from Tim Hyder (2008) and Roman Ignatov (2006)
If you're looking to elevate your trading game, the QQE and QQE Multi-Timeframe (MTF) indicators are essential tools in your arsenal.
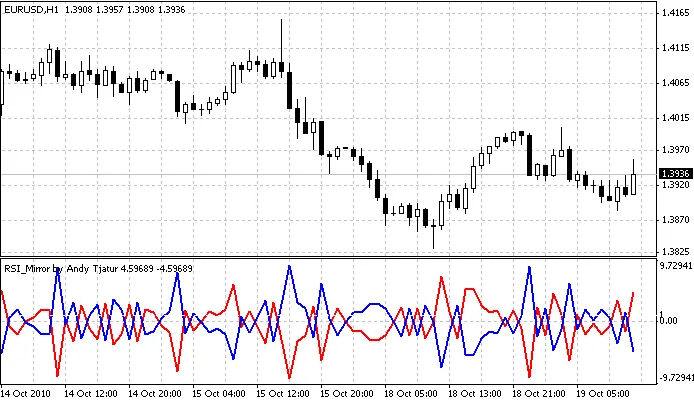
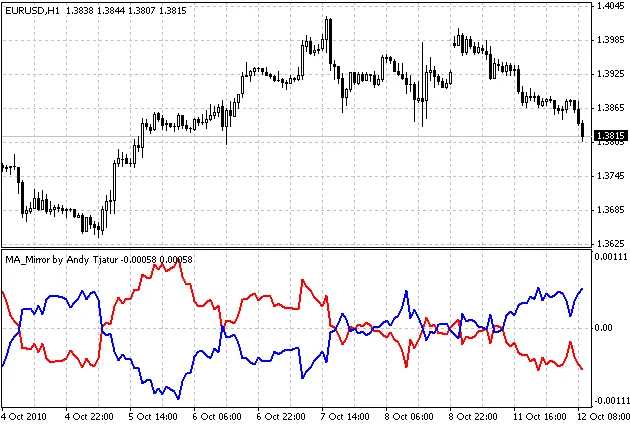
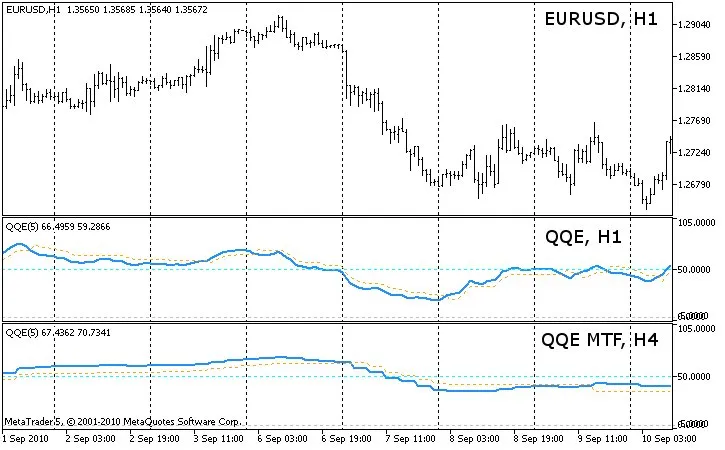
The QQE, or Qualitative Quantitative Estimation, is derived from two main indicators:
Moving Average (MA) on the Relative Strength Index (RSI)
The difference between the MA on RSI and the MA of the Average True Range (ATR) of the MA of RSI
BUY Signal: This occurs when the blue line crosses above the level 50 after crossing the yellow line from below.
SELL Signal: This happens when the blue line crosses below the level 50 after crossing the yellow line from above.
The QQE MTF indicator can be utilized across any timeframe, whether it’s a higher or lower timeframe than your current chart. This flexibility allows you to tailor your strategy effectively.
Compared to the original QQE, the QQE MTF offers an additional setting for a second timeframe to be used in calculations, enhancing your analytical capabilities.
However, keep in mind that when using the QQE MTF on a timeframe that's lower than your current chart's timeframe, not all values can be displayed. Instead, the indicator will adapt based on the price type you've selected to deliver the most relevant data.
Here are a couple of practical examples:
Timeframe 1 = 5 minutes, Timeframe 2 = 1 minute (using Close price series): For each bar on Timeframe 1, the indicator will display the most recent bar from Timeframe 2 that closed on or before the Close time of the bar on Timeframe 1. This applies to both closed bars and the current open bar.
Similarly:
Timeframe 1 = 5 minutes, Timeframe 2 = 1 minute (using Open price series): For each bar on Timeframe 1, the indicator shows the latest bar from Timeframe 2 with an opening time on or before the Open time of the bar on Timeframe 1. This is particularly useful if you trade based on the opening of new bars.
Feel free to mix and match any timeframes, even if they don’t sync up perfectly. For instance, you can use a 5-minute timeframe alongside a 12-minute timeframe. The indicator will ensure they stay aligned for accurate analysis.
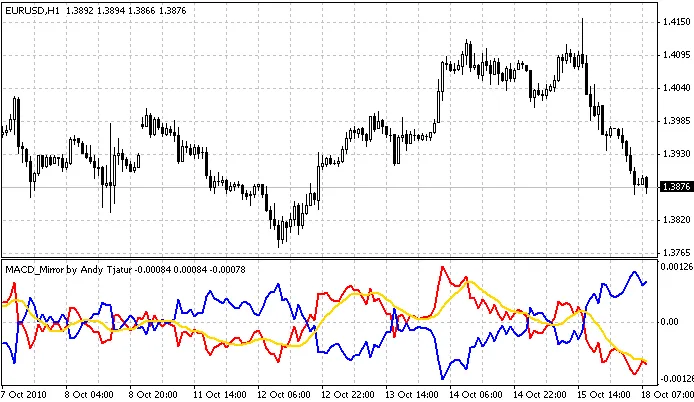
For a more visual explanation, check out the MACD Histogram MC_MTF indicator, which includes a helpful Excel sheet.
Note: When switching between timeframes, give it a few seconds for the price data to load. If the indicator doesn’t appear, try refreshing the chart manually.
To get the QQE MTF working, make sure to place both qqe_mtf.mq5 and qqe.mq5 in the \MQL5\Indicators folder.
If you want to toggle error messages for troubleshooting, check the source code:
bool ShowErrorMessages=false // turn on/off error messages for debugging
Update History for QQE:
2010 09 26: v02
Code has been revised to enhance compatibility with MetaTrader 5;
Corrected erroneous values at the chart's start;
Update History for QQE MTF:
2010 09 26: v02
Improved value display on smaller timeframes;
Changed buffers to EMPTY_VALUE instead of 0 after: if(convertedTime<tempTimeArray_TF2[0]);
Optimized the code;
Removed PLOT_DRAW_BEGIN from OnInit() - inherited from single timeframe indicator;
Moved ArraySetAsSeries of buffers and arrays into OnInit().
2010.09.29