MetaTrader4
Unlock Your Trading Potential with FX Multi-Meter II
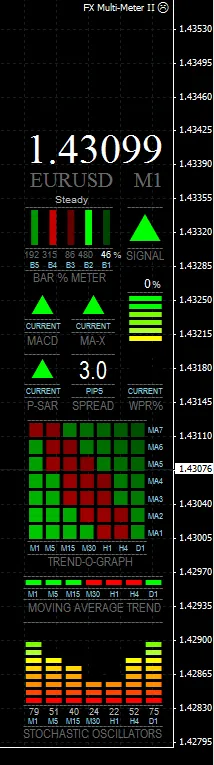
FX Multi-Meter II
Introducing the FX Multi-Meter II – your ultimate trading companion! Inspired by the !x-meter, this all-in-one indicator brings you a wealth of information at a glance, eliminating the need for multiple charts and reducing screen clutter. Designed to enhance both your trade entries and exits, the Multi-Meter provides an instant snapshot of a currency pair's movement. Whether you're trading Forex or any other currency, this tool works seamlessly across all timeframes.
--------------------------------------------------------------------
Key Features
A graph showcasing Stochastic Oscillators across timeframes from M1 to D1.
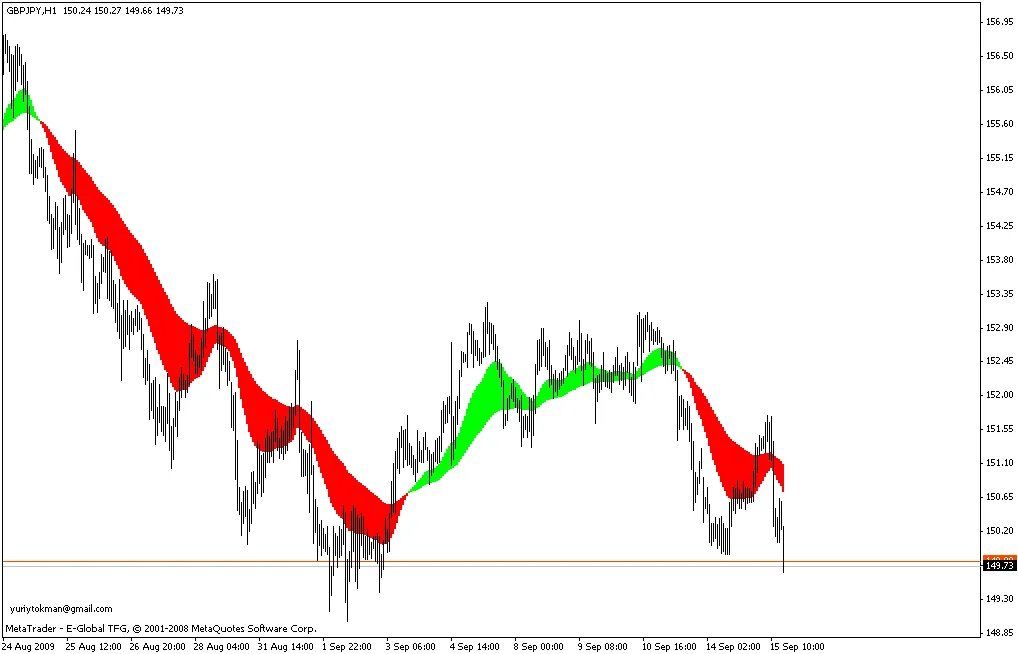
Market trend indications using Moving Averages on timeframes M1 to D1.
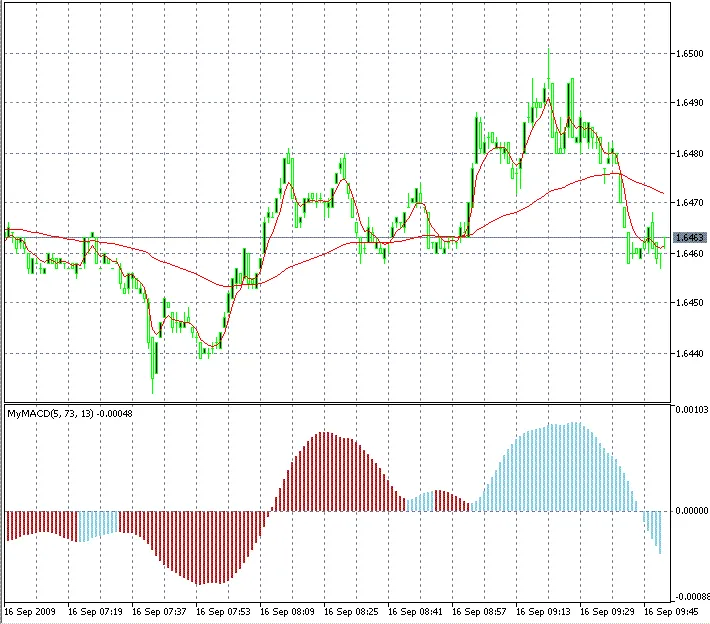
Real-time MACD direction on the current chart, including crossings of the signal and zero lines.
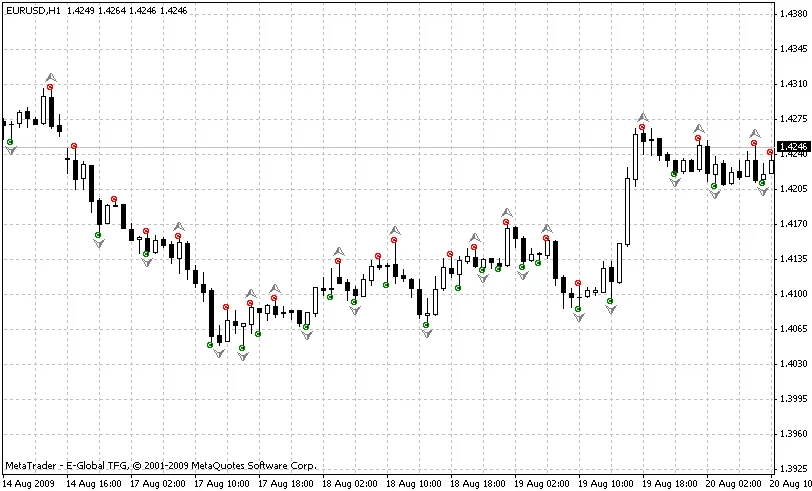
Fast 3-period LWMA crossing a 5-period SMA to indicate market direction (customizable periods).
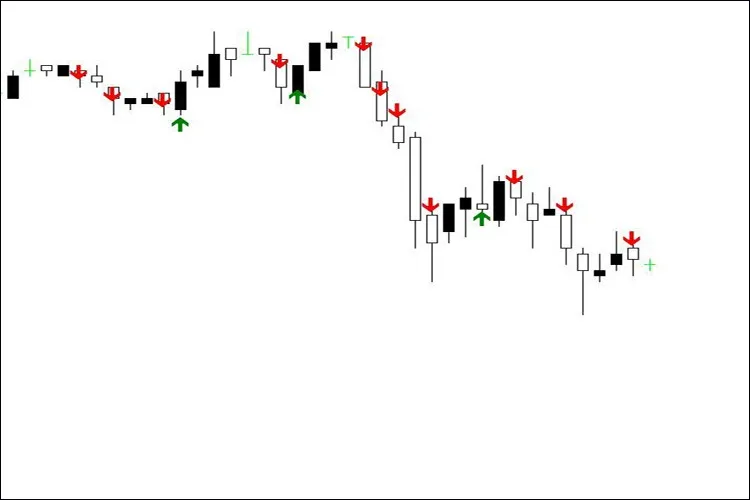
Parabolic SAR to signal exits and confirm entries on the current chart.
An oscillating graph of William's % Range for quick identification of Overbought/Oversold conditions.
A Bar % Increase/Decrease meter that visually represents the percentage rise or fall in current price compared to the last four bars, with color coding for strength of movement.
A comprehensive recommended trading signal based on various indicator outputs.
Clear, large numbers for currency spreads for easy visibility.
-----------------------------------------------------------------------------------------------------
What’s New in Version 2?
A History viewer that can be dragged over previous bars to access historical data in Multi-Meter (Beta version).
A multi-timeframe Trend Graph displaying the direction of 7 customizable Moving Averages.
An Overbought/ Oversold (OB/OS) Signal Map, indicating signals from 7 different oscillators/indicators across 7 timeframes.
Customizable Overall Signal based on a combination of current and multi-timeframe indicators.
Toggle for Price/Chart/Currency display for user preference.
Switch between Default and Compact modes for display options.
Options can now be accessed without needing to reload the chart.
-------------------------------------------------------------------------
Trend-O-Graph and Price displayedInstallation Instructions
========
INSTALLATION: Close MetaTrader if it’s running. Copy the mq4 file to Program Files/(MetaTrader4 directory)/experts, and the Fonts from the zip file to C:/Windows/Fonts.
Launch MetaTrader and open MetaEditor. In the Navigator window, double-click on FX Multi-Meter II to open it. Press the Compile button and return to MetaTrader.
In the left Navigator window, open the experts folder and drag Multi-Meter onto a chart. The Options panel will appear, allowing you to customize settings. Click
Ok, and you’re all set! Compiling is only needed once.
------------------------------------------------------------------------------------------------------
Options
========
NOTE: To access the Options (Inputs) for Multi-Meter without reloading, switch to the Monthly timeframe and press F7. By default, Multi-Meter is disabled on the Monthly timeframe to prevent an infinite loop that restricts access to Options. This loop can be temporarily broken by using the Monthly chart.
HISTORY LINE - Enable or disable the History Line. When first loaded, the History Line appears slightly ahead of the current time. You can drag it across previous bars to view historical indicator values. It can be deleted anytime, but switching timeframes will generate a new one.
COMPACT MODE - Switch from the default full display to a more compact version. Note that the Trend Graph or the OB/OS Signal Map will not be available in compact mode.
DISPLAY PRICE/CHART/CURRENCY - Customize the Price/Chart/Currency display, including font size and color options.
USE MONTHLY CHART FOR OPTIONS - DisableMonthly allows Options access on the Monthly chart.
PROCESSING LATENCY (SLEEP) - Adjust the milliseconds that the program loop pauses before restarting. Default is 100. Reducing this value can enhance responsiveness but avoid going too low to prevent flickering.
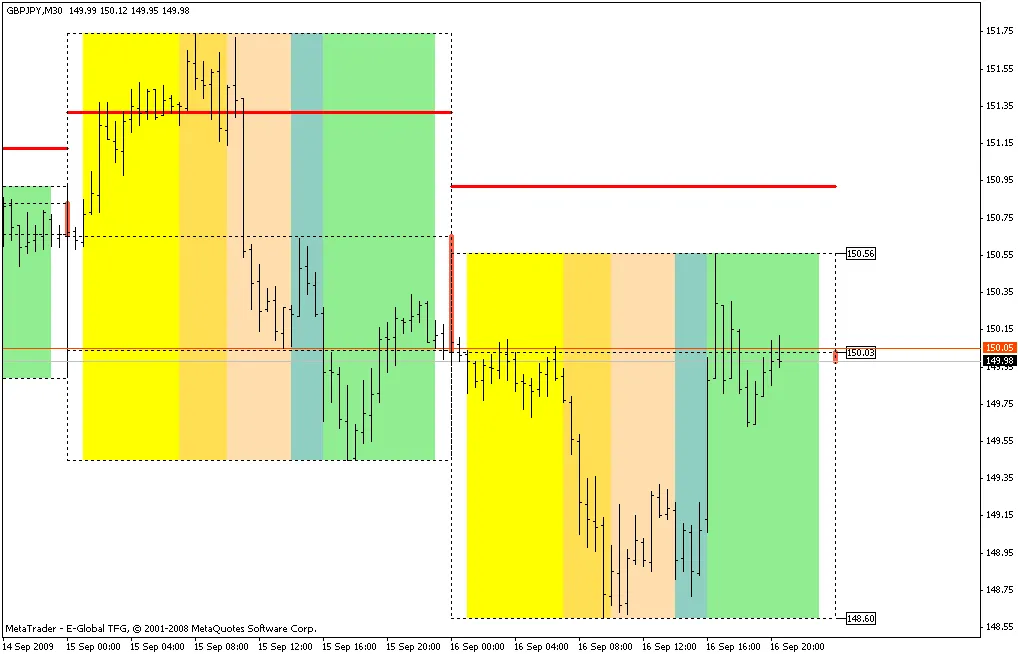
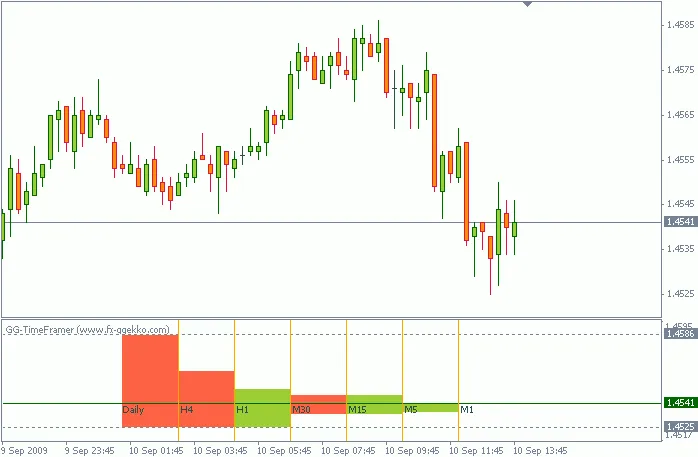
TREND-O-GRAPH - This graph illustrates short and long-term trend waves. Toggle between the Trend Graph and OB/OS Signal Map as needed.
OVERALL SIGNAL - Configure this to include or exclude various indicator directions for trade entry confirmation.
OB/OS SIGNAL MAP - Displays 7 indicators across 7 timeframes. It indicates Overbought/Oversold conditions, with customizable zone values.
INDICATOR VALUES - Adjust the MA-Xover signal, MACD signal, Parabolic SAR signal, MA Trend Bar, W%R, and Stochastics as needed.
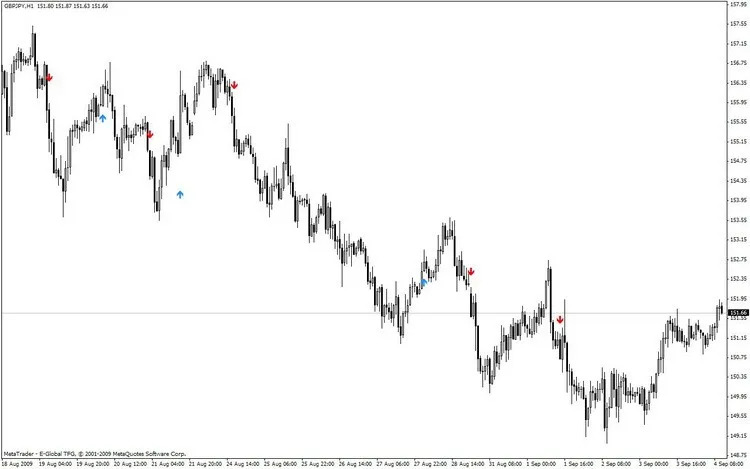
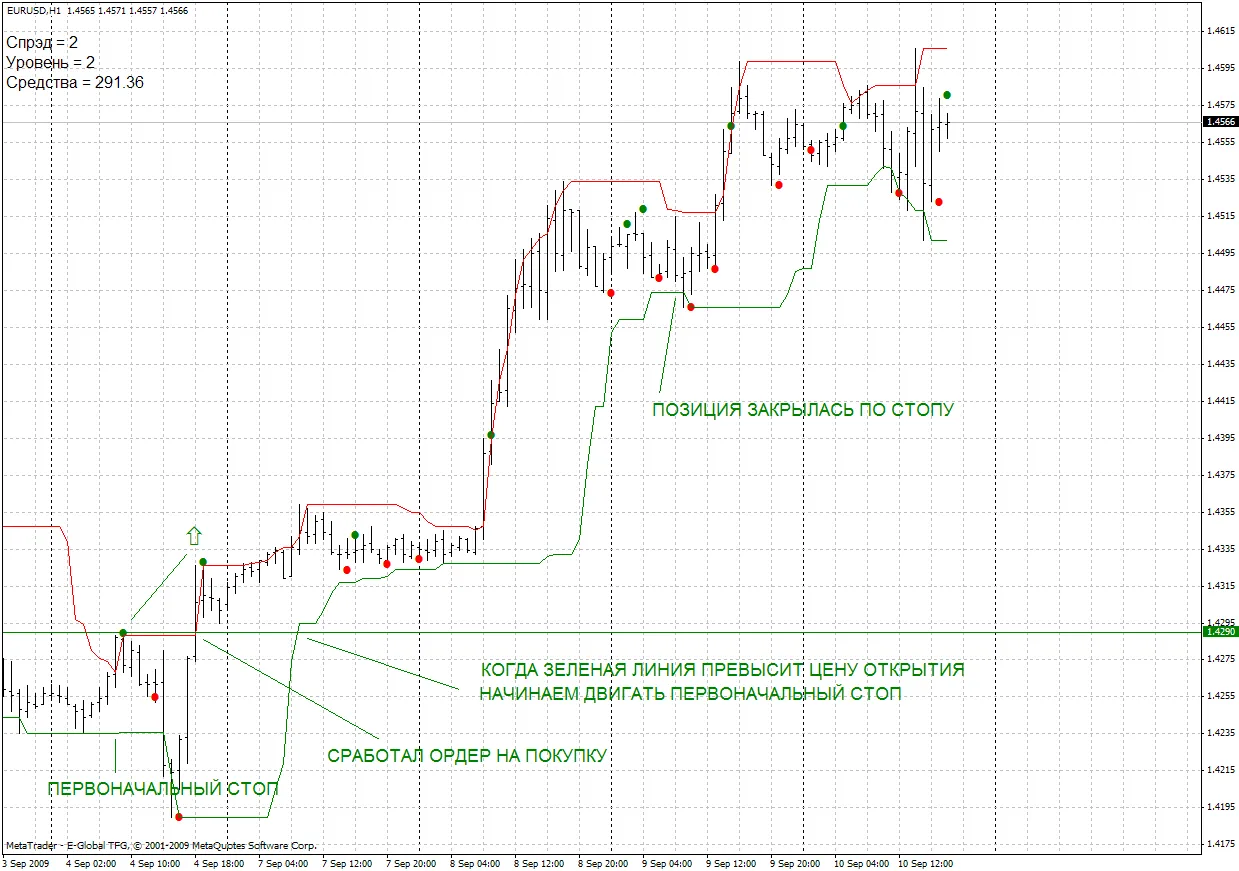
Reversal Trade setup
Understanding the Signals
As Multi-Meter directly displays various indicators, it’s crucial to understand each one for effective interpretation. Check out this resource for more insights.
The Bar % Meter is akin to the Rate Of Change indicator. The Overall Signal can be customized with different conditions. Here’s a quick guide to reading the Meter:
Determine the long-term trend using the MA Trend Bar or Trend Graph. Check PSAR readings on slower timeframes (H1 to W1).
Identify the short-term trend with the MA Trend Bar, Trend Graph, MACD, MA-X, and P-SAR on faster timeframes (M1 to M30).
Utilize Stochastics, W%R, and the OB/OS Signal Map to spot Overbought/Oversold conditions.
Use the Bar % Meter to identify acceleration or deceleration in price movement.
MA-X typically signals the first indication of a price direction reversal after the Bar % Meter.
MACD will follow, confirming the MA-X reversal.
P-SAR will confirm if the reversal is valid, especially useful for exiting trades.
The Overall Signal combines selected indicators for trade entry confirmation.
A simpler approach could be: if everything is Green, BUY; if everything is Red, SELL.
Example Interpretation for Reversal Trade Setup:
- OB/OS Signal Map shows an extremely Oversold condition on M1 to H1 charts, recommending a BUY.
- Bar % Meter indicates strong bearish movement is slowing and starting to rise.
- MACD is trending downwards.
- MA-X shows the fast 3-period Linear Weighted MA is below the slower 5-period Simple MA.
- P-SAR has yet to swing, indicating the trend remains intact.
- WPR% is in Oversold territory.
- All MAs, except for D1, are trending downwards.
- Stochastic Oscillator readings on five timeframes are at rock bottom.
- Current spread is 0.8 pips. Sweet!
- Overall Signal = Wait (for confirmation to Buy)
2009.09.02