Let’s dive into the FFT Spectrum Analyzer, a powerful tool that utilizes Fast Fourier Transform to give you insights into market trends. You can check it out here.
Understanding the Spectrum Analyzer
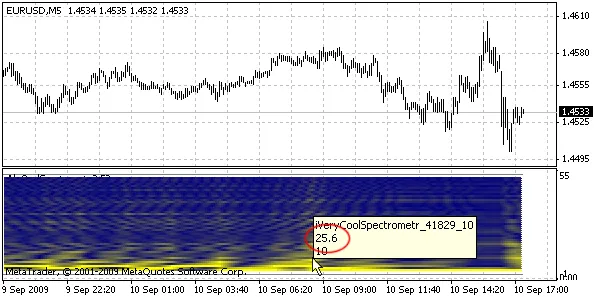
On the vertical axis, you’ll see the frequency, which represents the period length in bars. If you hover your mouse over it, you’ll get the exact value. The intensity of the yellow color indicates amplitude—the brighter the color, the higher the amplitude. This can provide you with valuable insights into the market movements!
Key Parameters:
- FFTPower: This sets the size of the analyzed window—expressed as a power of two. For example, a value of 8 analyzes 256 bars.
- ShowBars: This parameter defines how many bars will be analyzed.
- Shift: This determines the shift in bars for analysis.
- From_T: Sets the minimum displayed period (the value at the bottom of the chart).
- To_T: Sets the maximum displayed period (the value at the top of the chart).
- MaxColor: The color representing maximum amplitude.
- MinColor: The color representing minimum amplitude.
By mastering these parameters, you can better analyze market trends and make more informed trading decisions.


Comments 0