Technical Indicator

Mastering the Adaptive Moving Average (AMA) for Your Trading Strategy
MetaTrader5
Mastering the Adaptive Moving Average (AMA) for Your Trading Strategy

The Adaptive Moving Average (AMA) is a powerful tool used in MetaTrader 5 that helps traders smooth out price fluctuations while minimizing lag, making it easier to spot trends. This indicator was brought to life by Perry Kaufman in his insightful book, "Smarter Trading". One common pitfall with traditional smoothing algorithms is that sudden price jumps can create misleading trend signals. While smoothing is essential, it often introduces lag that can hinder timely decision-making. The AMA was designed with these challenges in mind, helping you navigate the market more effectively. Adaptive Moving Average Indicator How the AMA Works: To determine the current market state, Kaufman introduced the concept of the Efficiency Ratio (ER). This is calculated using the formula: ER(i) = Signal(i) / Noise(i) Where: ER(i) - current value of the Efficiency Ratio; Signal(i) = ABS(Price(i) - Price(i - N)) - the absolute difference between the current price and the price N periods ago; Noise(i) = Sum(ABS(Price(i) - Price(i-1)), N) - the total of absolute price differences over N periods. In strong trends, the Efficiency Ratio (ER) will approach 1, while in sideways markets, it will hover just above 0. This ER value feeds into the exponential moving average formula: EMA(i) = Price(i) * SC + EMA(i-1) * (1 - SC) Where: SC = 2/(n+1) - the EMA smoothing constant, where n is the period; EMA(i-1) - the previous EMA value. For fast-moving markets, the EMA period should be set to 2 (yielding a fast SC of 0.6667), while during non-trending periods, an EMA period of 30 is recommended (slow SC = 0.06452). This leads us to introduce the scaled smoothing constant (SSC): SSC(i) = (ER(i) * (fast SC - slow SC) + slow SC Or alternatively: SSC(i) = ER(i) * 0.60215 + 0.06425 To make the smoothing constant more effective, Kaufman suggests squaring it. The final calculation for the AMA is as follows: AMA(i) = Price(i) * (SSC(i)^2) + AMA(i-1) * (1 - SSC(i)^2) Rearranged, it looks like this: AMA(i) = AMA(i-1) + (SSC(i)^2) * (Price(i) - AMA(i-1)) Where: AMA(i) - current value of the AMA; AMA(i-1) - prior value of the AMA; SSC(i) - current value of the scaled smoothing constant.

2010.01.08
Mastering the Average Directional Movement Index (ADX) for Trading Success
MetaTrader5
Mastering the Average Directional Movement Index (ADX) for Trading Success

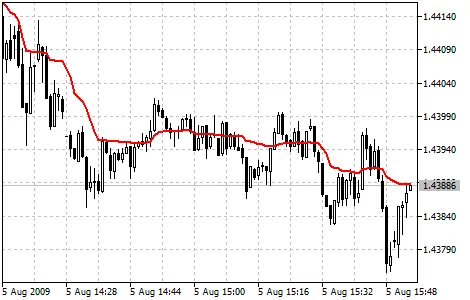
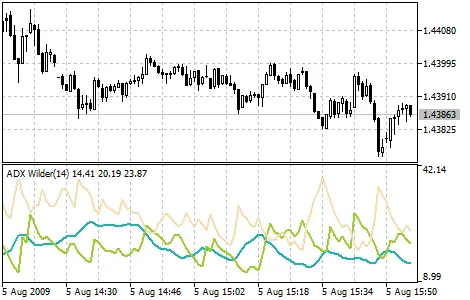
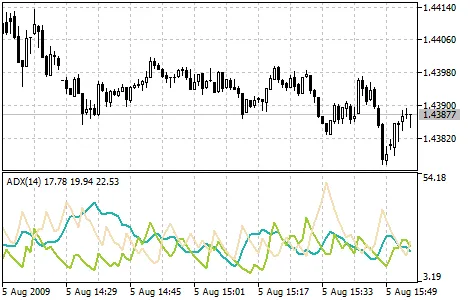
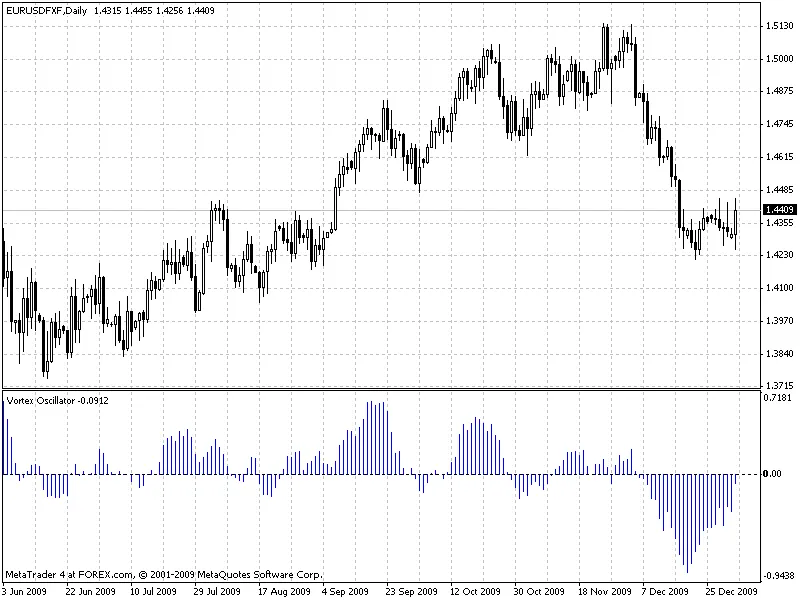
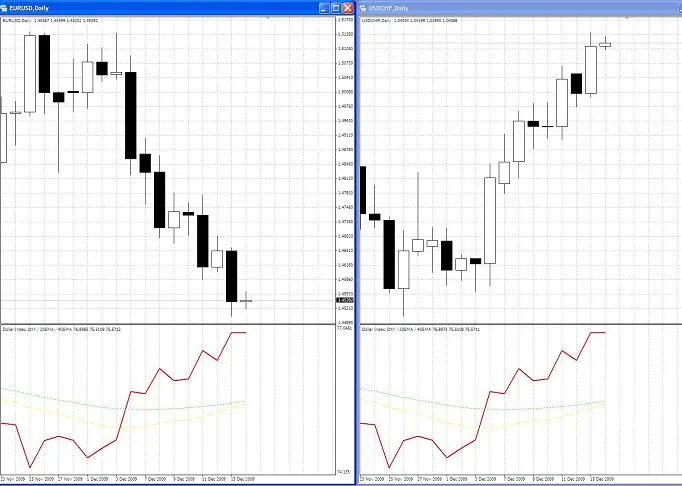
Average Directional Movement Index (ADX), often referred to as ADX Wilder, is a crucial tool for traders looking to identify market trends. This technical indicator is designed according to the methodology laid out by Welles Wilder in his influential book, "New Concepts in Technical Trading Systems". You can find detailed trading rules for the ADX in the Average Directional Movement Index documentation. How the ADX is Calculated: The calculation begins with determining the positive (dm_plus) and negative (dm_minus) movements for each bar, as well as the true range (tr): If High(i) - High(i-1) > 0  dm_plus(i) = High(i) - High(i-1), otherwise dm_plus(i) = 0. If Low(i-1) - Low(i) > 0  dm_minus(i) = Low(i-1) - Low(i), otherwise dm_minus(i) = 0. tr(i) = Max(ABS(High(i) - Low(i)), ABS(High(i) - Close(i-1)), ABS(Low(i) - Close(i-1))) Where: High(i) - highest price of the current bar; Low(i) - lowest price of the current bar; High(i-1) - highest price of the previous bar; Low(i-1) - lowest price of the previous bar; Close(i-1) - closing price of the previous bar; Max(a, b, c) - maximum value among a, b, and c; ABS(X) - absolute value of X. Next, we calculate the smoothed values: Plus_D(i), Minus_D(i), and the Average True Range (ATR): ATR(i) = SMMA(tr, Period_ADX,i)Plus_D(i) = SMMA(dm_plus, Period_ADX,i)/ATR(i)*100Minus_D(i) = SMMA(dm_minus, Period_ADX,i)/ATR(i)*100 Where: SMMA(X, N, i) - Smoothed Moving Average of the X series for the current bar; Period_ADX - number of bars used for calculation. Now, we compute the Directional Movement Index (DX(i)): DX(i) = ABS(Plus_D(i) - Minus_D(i))/(Plus_D(i) + Minus_D(i)) * 100 After these preliminary calculations, we derive the value of the ADX(i) for the current bar by smoothing the DX values: ADX(i) = SMMA(DX, Period_ADX, i)

2010.01.08
Unlocking the Accelerator Oscillator (AC) for MetaTrader 5: A Trader's Guide
MetaTrader5
Unlocking the Accelerator Oscillator (AC) for MetaTrader 5: A Trader's Guide

As traders, we know that price is the last piece of the puzzle to move. Before prices shift, the market's driving force takes a turn. The acceleration of this driving force needs to slow down and hit zero before it starts to gain momentum in the opposite direction. This is where the Accelerator Oscillator (AC) comes into play. The Acceleration/Deceleration indicator helps us measure that momentum. It changes direction before the driving force does, giving us a heads-up before prices shift. Understanding this can give you a significant edge in your trading strategy. The zero line is where the driving force balances out with acceleration. If the AC is above zero, it’s usually easier for the acceleration to keep pushing prices up, and vice versa when it dips below zero. Unlike the Awesome Oscillator, crossing the zero line isn’t a signal to trade. Instead, focus on the color changes of the histogram. A crucial rule to remember: don’t buy when the current column is red, and don’t sell when it’s green. When you’re ready to enter the market, align your trades with the direction of the driving force. If the AC is above zero, it’s a good time to buy; if it’s below, consider selling. You’ll want to see two green columns for a buy signal (or two red for a sell). If the driving force is against your intended position (like the AC being below zero for a buy), you’ll need confirmation — which means looking for three consecutive columns in the same color. So for a short position, aim for three red columns above zero, and for a long position, three green columns below zero. How to Calculate the AC: The AC bar chart is derived from the difference between the 5 and 34 period values of the driving force bar chart and the 5-period simple moving average (SMA) calculated from that chart. MEDIAN PRICE = (HIGH + LOW) / 2 AO = SMA (MEDIAN PRICE, 5) - SMA (MEDIAN PRICE, 34) AC = AO - SMA (AO, 5) Where: MEDIAN PRICE - the median price; HIGH - the highest price of the bar; LOW - the lowest price of the bar; SMA - Simple Moving Average; AO - Awesome Oscillator.

2010.01.07
Unlock Your Trading Potential with SuperMultiChart for MetaTrader 4
MetaTrader4
Unlock Your Trading Potential with SuperMultiChart for MetaTrader 4

Hey there, fellow traders! As the holiday season rolls in, I'm excited to share something truly special with all of you! Introducing the SuperMultiChart, a powerful tool designed for MetaTrader 4 that can transform your trading experience! What Makes SuperMultiChart So Versatile? Unlimited Currency Selection: Choose as many currencies as you like, organized in a way that suits your trading style. Display Range Settings: Adjust the width of each currency chart to your preference. Individual Period Settings: Set the time frame for each currency chart separately. Visual Positioning: Easily manage the overall position of your multi-chart within the window. Customizable Information: Add extra details in the program code for display as needed. How to Use It Effectively? The SuperMultiChart is perfect for analyzing multiple currencies or even tracking a single currency across various time frames. It's great for spotting correlations and identifying group movements in the market. Check out the example below to see these factors in action: In this image, you can see a handy "handle" that allows you to move the multi-chart up or down within the window. You can refresh the chart manually or it will update automatically when new ticks arrive. Chart Settings: Setting of the charts: Instruments = "EURUSD240 EURUSD60 EURUSD30 EURUSD15 EURUSD5 EURUSD1"; Bars_ = 12; // Number of bars in the chart ChartsGap = 1; // Spaces between the charts GoldColor = False; // Toggle gold color scheme for dark backgrounds Setting of lines: VertLineColor = Blue; // Color of vertical lines VertLineWidth = 1; // Width of vertical lines VertLineStyle = 2; // Style of vertical lines Setting of text: TextY = 60; // Space from the bottom edge TextYStep = 20; // Height of lines FontSize = 10; // Size of the font TextColor = Blue; // Color of the text UpColor = Green; // Color for rising prices DnColor = Red; // Color for falling prices Important Note: Ensure that instruments in the list are separated by a space. To change the period, write it directly after the instrument without a space. To disable an instrument, simply add a minus sign (-) before it. For example: Instruments = "EURUSD240 EURUSD60 EURUSD30 -EURUSD15" will display EURUSD charts for H4, H1, and M30 periods only. You can even hide the original instrument window by using a simple SMA with a period of 1 and matching the background color when switching the chart to line mode. Quick Reminder: Remember NOT to trade directly from this window! This is crucial to avoid accidental trades, especially when you have the original instrument displayed here. The multi-chart updates with new ticks from the original instrument or can be refreshed manually. Lastly, there's still plenty of space on your chart to add more text labels for displaying vital information. I've commented out a couple of lines in the LABELS block for you to customize: /// LABELS string Text = DoubleToStr(c, Digits); DrawText(LName+"_1", Time[B-6], WindowPriceMin()+TextY*Point, Symb, 0, TextColor, FontSize, 0); // You can add more labels as needed In Summary Here you have it, your new universal tool for exploring and conquering the market! Happy trading, and may your charts be ever in your favor!

2009.12.21
Mastering the Multi Moving Average Indicator for MetaTrader 4
MetaTrader4
Mastering the Multi Moving Average Indicator for MetaTrader 4

Author: Alex5757000 Introducing the Multi Moving Average Indicator - this handy tool displays the information of four different moving averages in a separate window, making it easier to analyze market trends without cluttering your price chart. You can easily customize the input parameters in the Indicator Properties window for each moving average: Averaging Period (period). Averaging Method (ma_method). Price type used for calculation (applied_price). Additionally, there are numerous options for text labels: This indicator is designed to simplify your price chart (especially concerning Moving Averages) while retaining vital information: It provides a snapshot of the current state of the moving averages, indicating whether they are trending upwards or downwards (using distinct colors for boxes and arrows). It shows the position of the moving averages relative to the price (or a Moving Average with a period of 1) - whether they are above or below the price (using different colors for the text labels). By configuring the Moving Averages periods, you can gauge the market trend without adding any moving averages to your price chart! Example Image: If you have any questions or suggestions to improve this indicator, feel free to send a private message. Editor's Note: This content is a mirror translation of the original Russian version. If you have any questions for the author, suggestions, or comments, it’s better to post them there. If you’ve found this code useful for your trading or educational purposes, don’t forget to thank the author!

2009.12.18
Mastering Williams Indicator for MetaTrader 4: Your Ultimate Guide
MetaTrader4
Mastering Williams Indicator for MetaTrader 4: Your Ultimate Guide

Hey there, fellow traders! If you’re diving into Bill Williams' trading strategies, you’ll definitely want to check out the Williams Indicator. This handy tool simplifies how you analyze the market by displaying key indicators like AO, AC, and MACD right on your MetaTrader 4 platform. What is the Williams Indicator? This indicator is designed for all the enthusiasts of Bill Williams' theories. Whether you're just starting out or looking to enhance your skills, this tool can really help you grasp his unique approach to trading. Not only does it provide a clearer visual representation of your charts, but it also helps you maximize your workspace, keeping everything organized while you trade. Understanding the Panels I've shared this panel as an example of how to create both static and movable information panels. It's a great way to visualize your settings without the hassle of navigating through multiple windows. Williams_Inds.mq4 - This is the code for the movable panel, which you can manually adjust on your chart. Williams_IndsS.mq4 - This represents a static panel with preset positioning. How to Use the Movable Panel The panel is adjustable based on the bars visible on your chart, making it easy to keep everything in sight. To move the panel, just double-click its border and drag it to your desired location. As new ticks come in, the content will update automatically. Keep in mind that you can only move it downwards and to the right from the last position. If you find yourself needing to reset it, simply hit the DELETE key, and it will return to the top-left corner of your screen for a fresh start. Besides the indicator arrows and labels, the panel also features two small icons: a hand and a bell. The hand icon toggles the manual dragging option on and off. Turning it off will lock the panel in place, while turning it on allows for adjustments. The bell icon signals when the indicators are moving in the same direction and will automatically turn off after notifying you. Setting Up the Static Panel The static panel is simpler and can be positioned using pixel coordinates, allowing for precise placement on your charts. Both panel types come in two themes to suit your preference: light or dark. You can set the White_Chart_Theme parameter to either True or False, depending on which style you prefer. Final Thoughts With this example, you can create your own information panels tailored to your trading needs. Get creative and make trading a more organized and efficient experience!

2009.12.18
First Previous 341 342 343 344 345 346 347 348 349 350 351 Next Last