MetaTrader4
Mastering Market Structure: Understanding Highs and Lows with the MSLM Indicator
Description
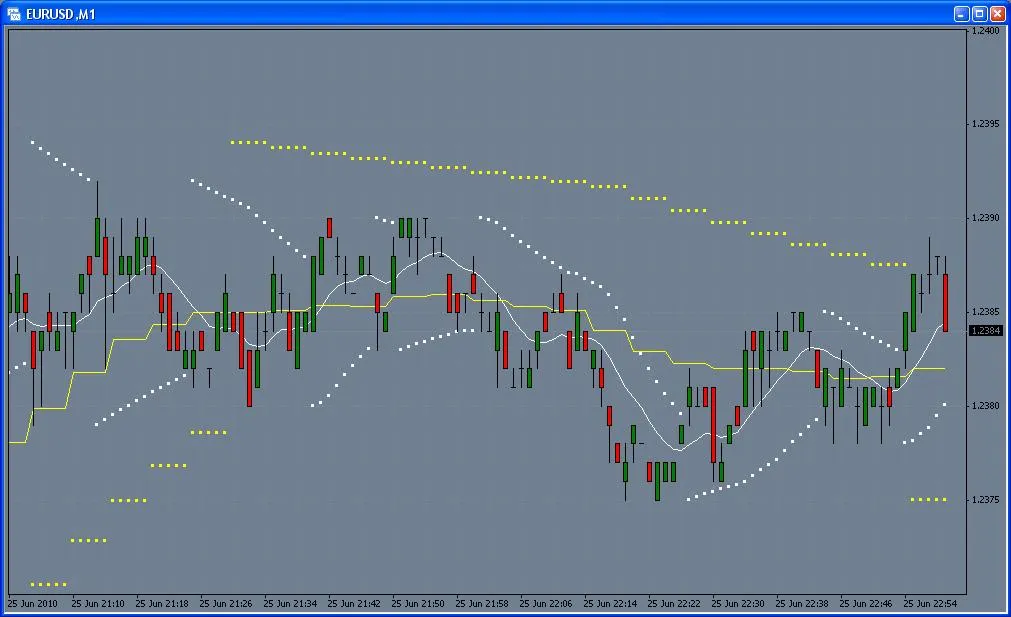
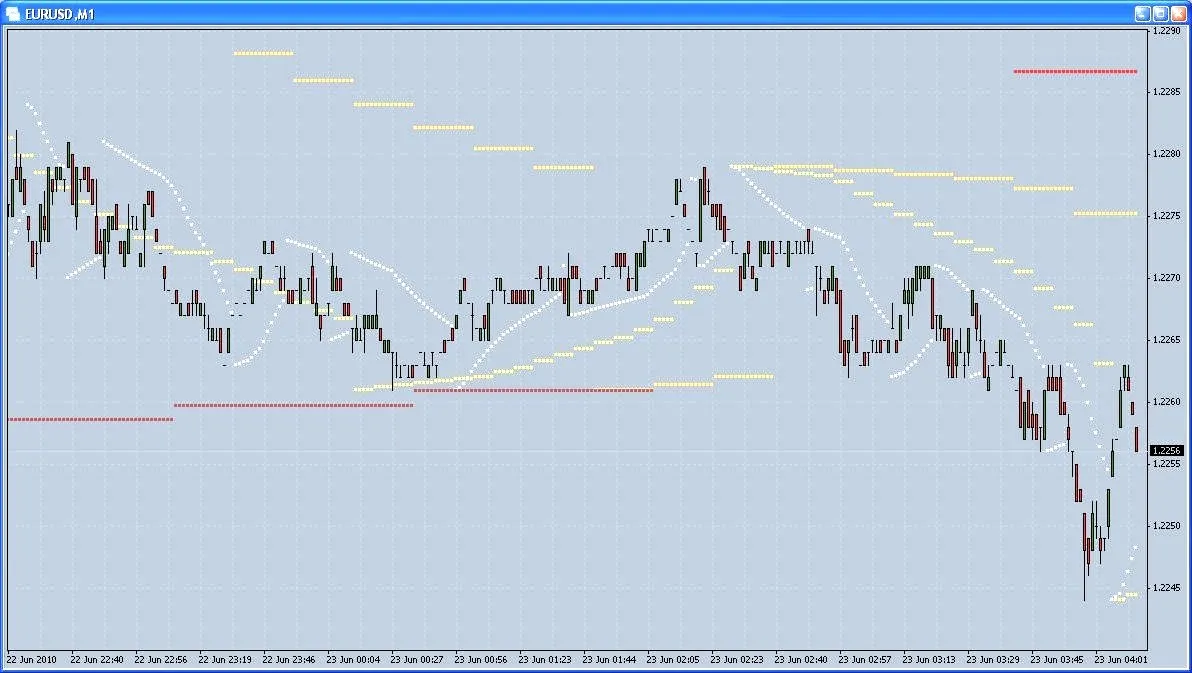
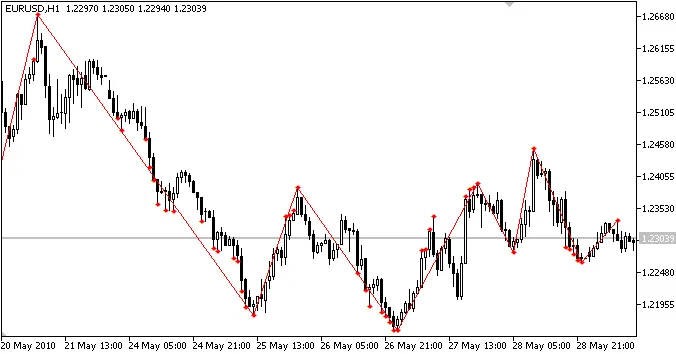
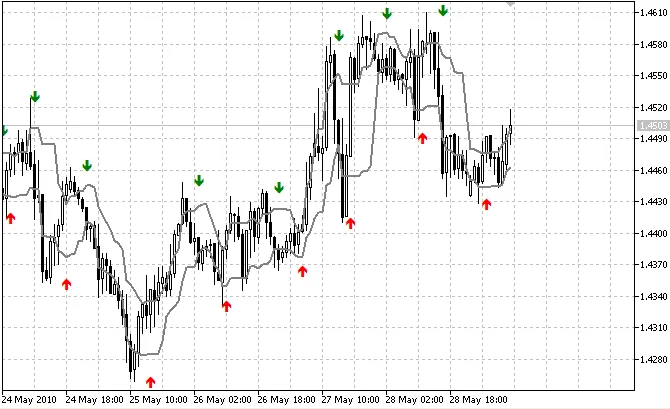
The MSLM indicator is designed to help you identify local highs and lows in the market. But what does that really mean? A local high or low is determined by the relationship between three consecutive candles. If the high of the middle candle is greater than those on either side, it marks a local high. Conversely, if the low is lower than its neighbors, it indicates a local low.
When the price breaks out past a local high or low, it opens the door for potential trading opportunities. This breakout can signal trends, particularly if you notice that the lows are consistently rising or the highs are falling.
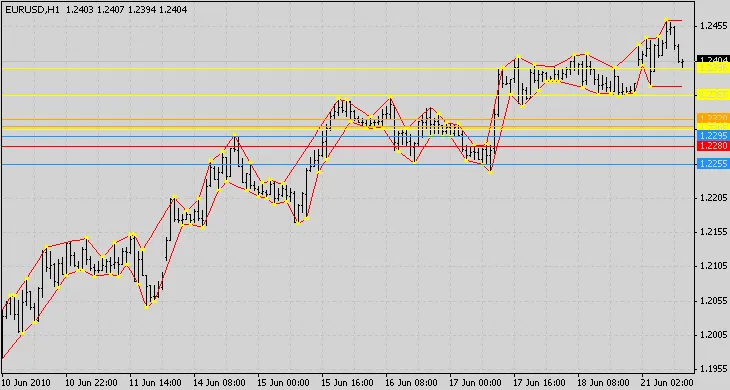
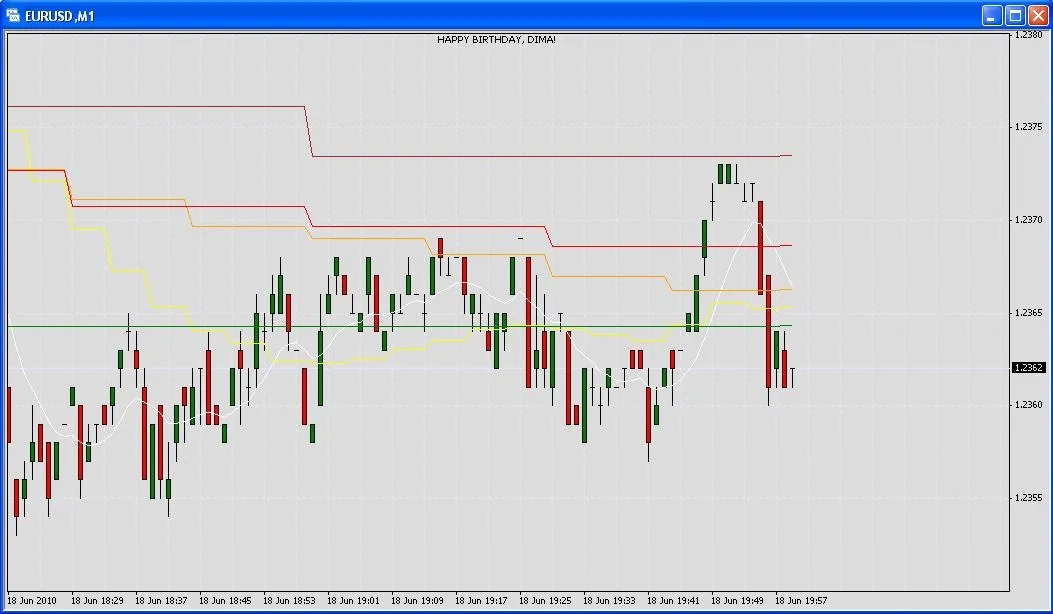
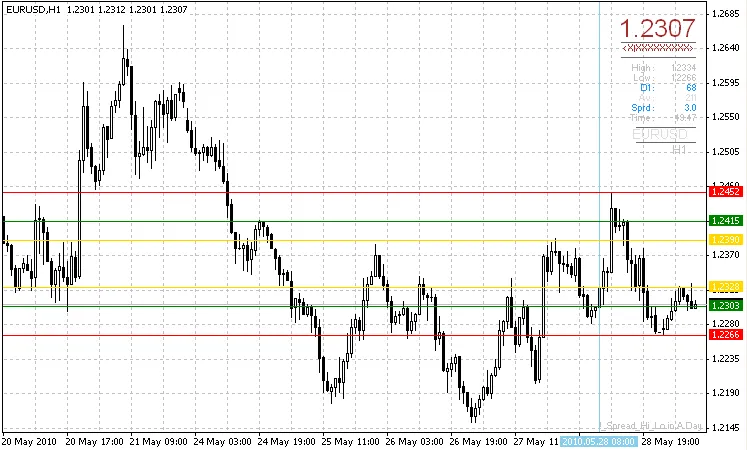
Each local high and low also serves as either a resistance or support level. The more frequently a price has been tested at these points, the stronger they become as resistance or support. The MSLM indicator keeps track of how many times the price has touched these points, visually representing this with a color code that ranges from white (weak) to red (strong).
Parameters
The indicator comes with a couple of parameters to help you manage the clutter of horizontal lines on your chart:
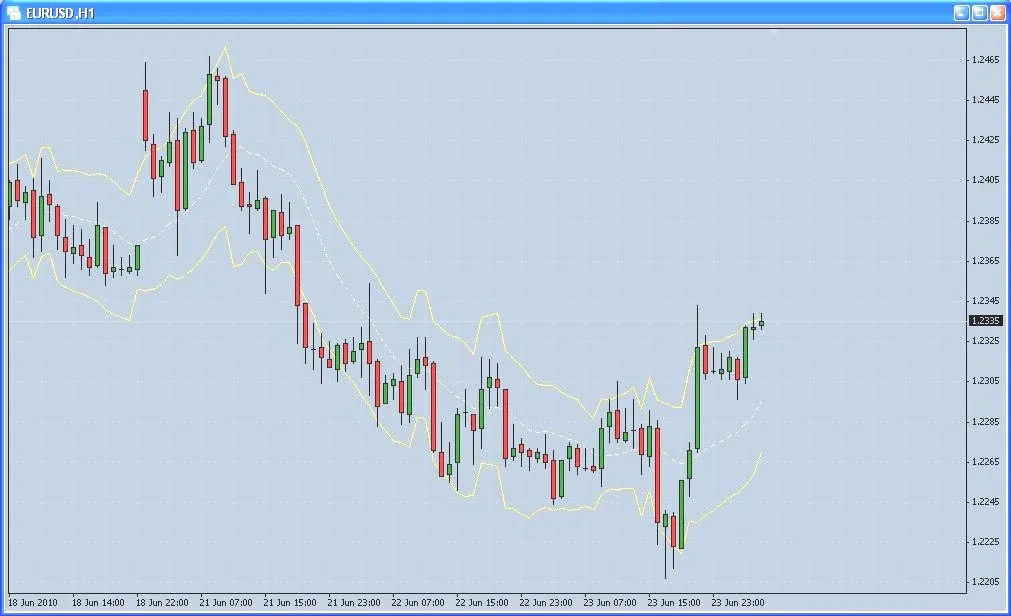
PipRange: This parameter allows you to consolidate the count if the price falls within a specified range of pips. For example, if you set PipRange to 10, then EUR/USD prices of 1.2000 and 1.2010 would share the same counter. However, if it's set to 1, you might see numerous lines in that range.
Percent: This parameter lets you display only the upper x% of the range. So, if a point has been hit a maximum of 10 times, setting this to 70 will only show points that have been tested at least 7 times with a horizontal line.
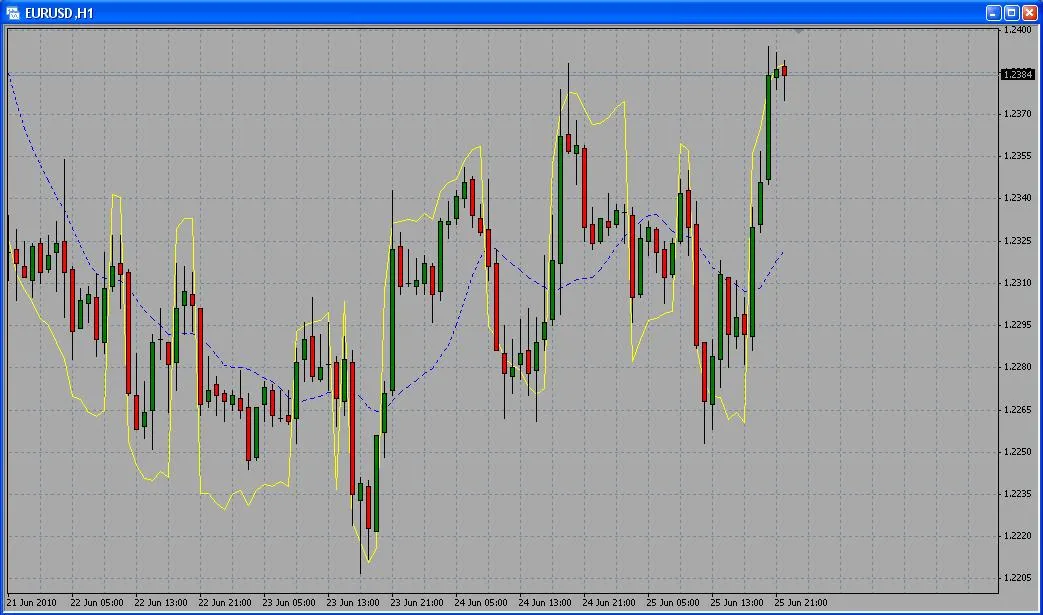
The horizontal lines are color-coded from White, Yellow, DodgerBlue, Orange, to Red, indicating their strength from weakest to strongest. Each line shows how many relative highs or lows have touched them.
Conclusion
When it comes to trading, the timeframe and chart data you're working with will dictate the best parameters to use for highlighting resistance zones. This can range from having no lines at all to displaying lines at every price level.
Keep in mind that the horizontal lines are generated from all candles in your chart, not just the visible ones. You can leverage these resistance zones to set your limit orders effectively.
Risk Warning
Always use this indicator at your own risk or consider using demo money to practice. Remember, this indicator isn't a magic crystal ball; it won't predict the market with certainty.
2010.06.21