Technical Indicator

Mastering the USD Strength Effect Indicator for MetaTrader 4
MetaTrader4
Mastering the USD Strength Effect Indicator for MetaTrader 4

Have you ever wondered how the USD stacks up against other currencies? The USD Strength Effect Indicator for MetaTrader 4 is your go-to tool for gaining insights into the strength of the USD across multiple pairs. It’s highly configurable, allowing you to tailor it to your trading needs. This indicator evaluates seven currency pairs based on a single base currency, giving you a clear picture of how the currency you're trading is performing. It assigns a value to each pair depending on the movement of two moving averages. If both moving averages are heading in the same direction, the value increases; if they’re moving in opposite directions, you’ll see a reduced value. The indicator operates on a scale from 10 (overbought) to -10 (oversold). It’s important to understand the difference between major pairs, like USD/CHF, and minor pairs, such as AUD/USD. You can select three major pairs and four minor pairs, all based on the same currency. The default settings are generally spot-on, so you may not need to tweak them much. For instance, if you prefer to use AUD as your base currency, you can choose three major AUD pairs and four minor AUD pairs. This will help you gauge the overall performance of the AUD, which is especially useful if you're focusing on markets like Tokyo. The USD Strength Indicator works wonders as a confirming signal alongside other indicators, like the Williams Percent Range, and often proves to be quite predictive. If you're looking to add an extra layer of confirmation within an Expert Advisor, you can use the following line of code: double val=iCustom(NULL, 0, "Brooky_USD_Strength", ".", ".", "USDCHF", "USDJPY", "USDCAD", ".", "AUDUSD", "EURUSD", "GBPUSD", "NZDUSD", ".", 55, 34, ".", 15, ".", 0, 1, 0); Feel free to adjust the 55 and 34 at the end to reflect the slow and fast Moving Averages you prefer for your strength calculations. Remember, if val >= 8, it indicates that the currency is overbought, while val

2010.07.12
Mastering Price Predictions with the Nearest Neighbor Indicator for MetaTrader 5
MetaTrader5
Mastering Price Predictions with the Nearest Neighbor Indicator for MetaTrader 5

If you're looking to up your trading game, understanding the k-Nearest Neighbor (k-NN) algorithm can be a game changer. This clever technique digs into past trading patterns, pinpointing the k most similar ones to the current market situation. From there, it forecasts future prices based on weighted voting from those neighbors. But here’s the twist: our indicator focuses on just one nearest neighbor, making it a straightforward 1-NN algorithm. This tool uses the Pearson correlation coefficient to measure the distance between the current pattern and historical ones, giving you a clear insight into future price movements. Here’s a quick rundown of the indicator’s input parameters: Npast - This is the number of past bars included in the pattern; Nfut - This refers to the number of future bars in the pattern (and it needs to be less than Npast). When you run this indicator, you’ll see two distinct curves: the blue curve reflects past prices of the nearest neighbor, while the red curve shows future prices based on the same pattern. The nearest neighbor is adjusted according to the linear regression slope between it and the current pattern, giving you a more accurate forecast. Additionally, the indicator provides valuable information about the starting date of the nearest neighbor along with its correlation coefficient to the current pattern. For example: Nearest_Neighbor (EURUSD, H1): Nearest neighbor is dated 2003.08.26 23:00:00 and has a correlation with the current pattern of 0.9432. Image:

2010.07.09
Mastering Fourier Extrapolation in MetaTrader 5: Your Guide to Price Prediction
MetaTrader5
Mastering Fourier Extrapolation in MetaTrader 5: Your Guide to Price Prediction

If you're diving into the world of trading, you might have heard of Fourier extrapolation as a powerful tool for price prediction. But what does it really mean? Let's break it down in simple terms. Understanding the Multi-Harmonic Model At its core, this method uses a multi-harmonic trigonometric model to analyze a price series, represented as x[i] for i from 1 to n. The formula looks like this: x[i] = m + Sum( a[h]*Cos(w[h]*i) + b[h]*Sin(w[h]*i), h=1..H ) Here's what each term in the equation represents: x[i] - This is the past price at the i-th bar, with a total of n past prices. m - This is the bias or baseline price. a[h] and b[h] - These are the scaling coefficients for the harmonics. w[h] - This indicates the frequency of a harmonic. h - This is the harmonic number. H - This denotes the total number of fitted harmonics. Fitting the Model To fit this model, you need to find values for m, a[h], b[h], and w[h] that closely match the actual market prices. The trickiest part is identifying the harmonic frequencies w[h]. For a Fourier series, these frequencies are typically set at 2πh/n. However, it's essential to note that Fourier extrapolation essentially repeats the n past prices into the future. This particular indicator leverages the Quinn-Fernandes algorithm to accurately determine harmonic frequencies. It fits each harmonic of the trigonometric series one at a time until it reaches the desired number of harmonics, H. After fitting a new harmonic, the algorithm calculates the residue between the updated model and the actual values, then fits another harmonic to this residue. Indicator Inputs Here are the key input parameters for the indicator: Npast - This is the number of past bars used for fitting the trigonometric series. Nfut - This indicates the number of future bars to be predicted. Nharm - This is the total number of harmonics included in the model. FreqTOL - This is the tolerance level for frequency calculations. How It Works Once set up, the indicator plots two distinct curves on your chart: a blue curve that shows the modeled past values and a red curve that represents the projected future values. This visual representation can help you make more informed trading decisions.

2010.07.05
Understanding Linear Regression Slope: A Key Indicator for MetaTrader 5
MetaTrader5
Understanding Linear Regression Slope: A Key Indicator for MetaTrader 5

When it comes to analyzing price data, linear regression is a powerful tool that traders can’t overlook. This method fits a straight line to the price data, helping us identify trends and make informed trading decisions. The equation for this line is: y[x] = y0 + b*x In this equation: x is the bar number (x = 1..n); y[x] refers to the corresponding price (like open, close, median, etc.); b is the proportionality coefficient; y0 is the bias. The slope of the linear regression, which this indicator provides, is actually a normalized version of the coefficient b. To calculate b, the formula is as follows: b = (n*Sxy - Sx*Sy)/(n*Sxx - Sx*Sx) Where: Sx = Sum(x, x = 1..n) = n*(n + 1)/2; Sy = Sum(y[x], x = 1..n); Sxx = Sum(x*x, x = 1..n) = n*(n+1)*(2*n+1)/6; Sxy = Sum(x*y[x], x = 1..n); n is the period of LRS (input parameter Per). The denominator of b can be simplified to: n*Sxx - Sx*Sx = n*n*(n-1)*(n+1)/12 Ultimately, we can simplify the entire equation for b to: b = 6*(2*Sxy/(n + 1) - Sy)/n/(n - 1) Now, it’s important to note that the coefficient b isn’t normalized. To make the LRS (Linear Regression Slope) comparable across different currency pairs, we need to normalize it. A common approach is to divide b by either a simple moving average (SMA) or a linear weighted moving average (LWMA). These are defined as: SMA = Sy/nLWMA = 2*Sxy/n/(n + 1) Thus, the corresponding versions of LRS are: LRS_SMA = b/SMA = 6*(2*Sxy/Sy/(n + 1) - 1)/(n + 1)LRS_LWMA = b/LWMA = 6*(1 - (n + 1)*Sy/Sxy/2)/(n + 1) In practice, these two normalization methods yield very similar results. For this reason, the SMA normalization was selected for the indicator. Additionally, because the LRS values can be quite small, the indicator’s values are calculated and plotted in parts per 100 thousand, which helps keep them within a range of -100 to +100.

2010.07.05
Mastering the BB_Support Indicator for MetaTrader 4: A Trader's Guide
MetaTrader4
Mastering the BB_Support Indicator for MetaTrader 4: A Trader's Guide

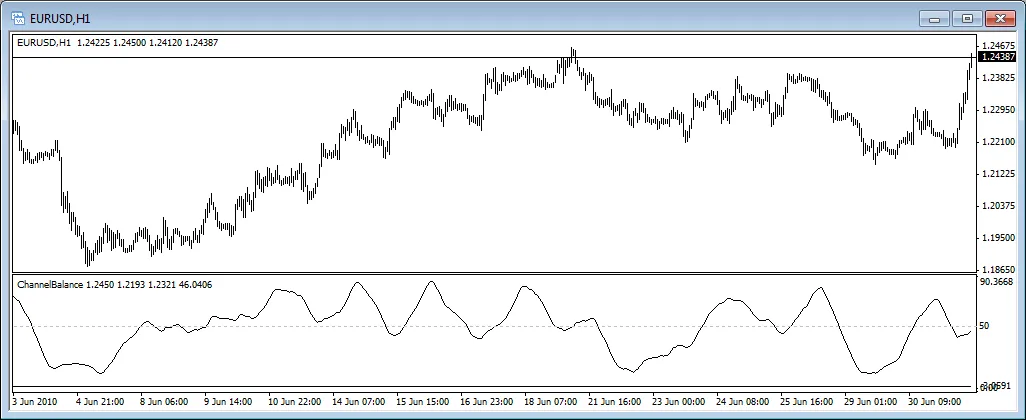
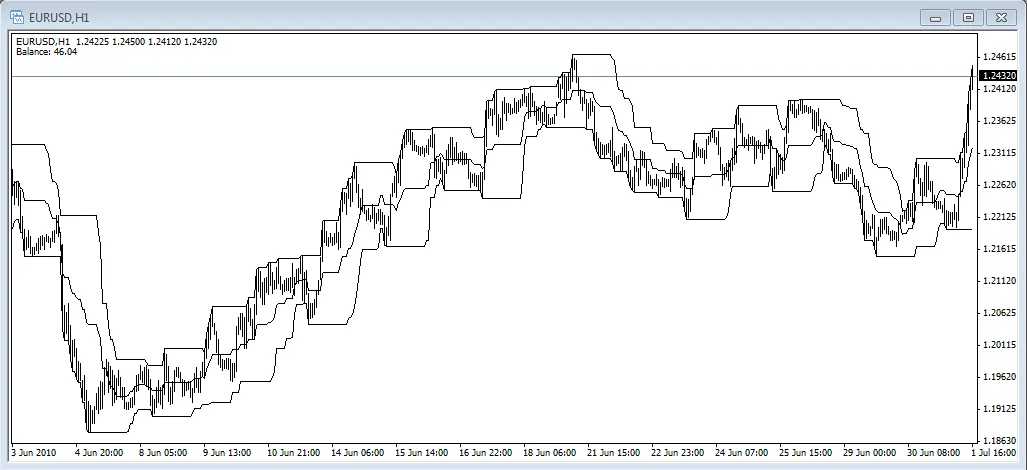
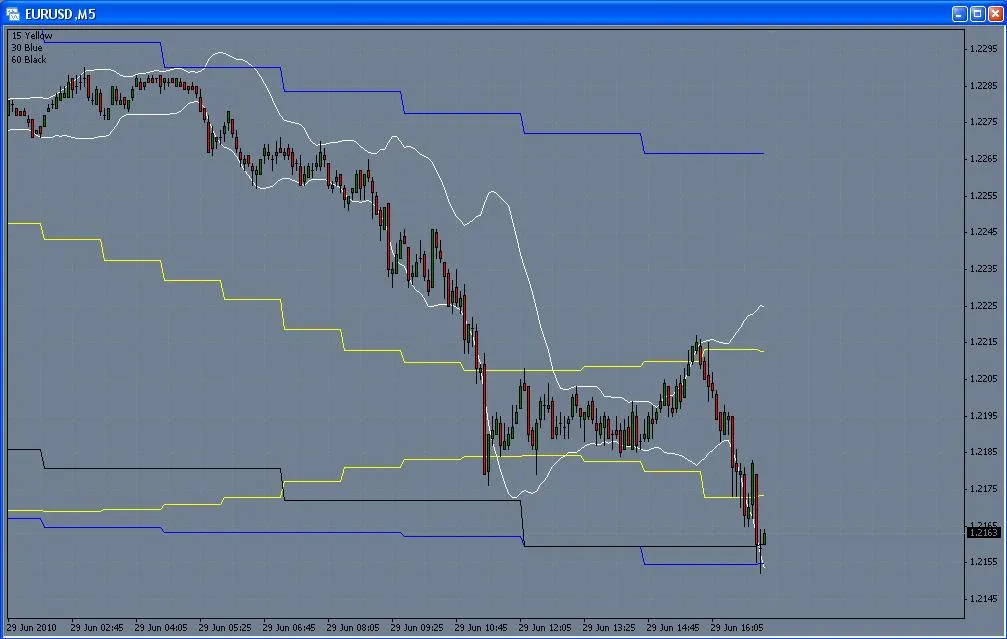
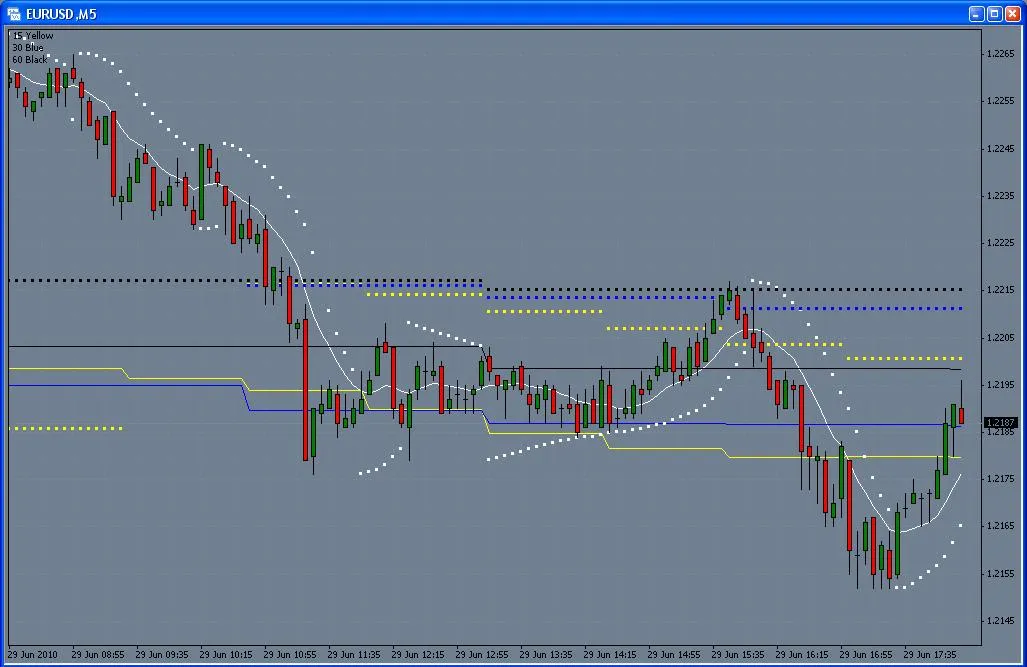
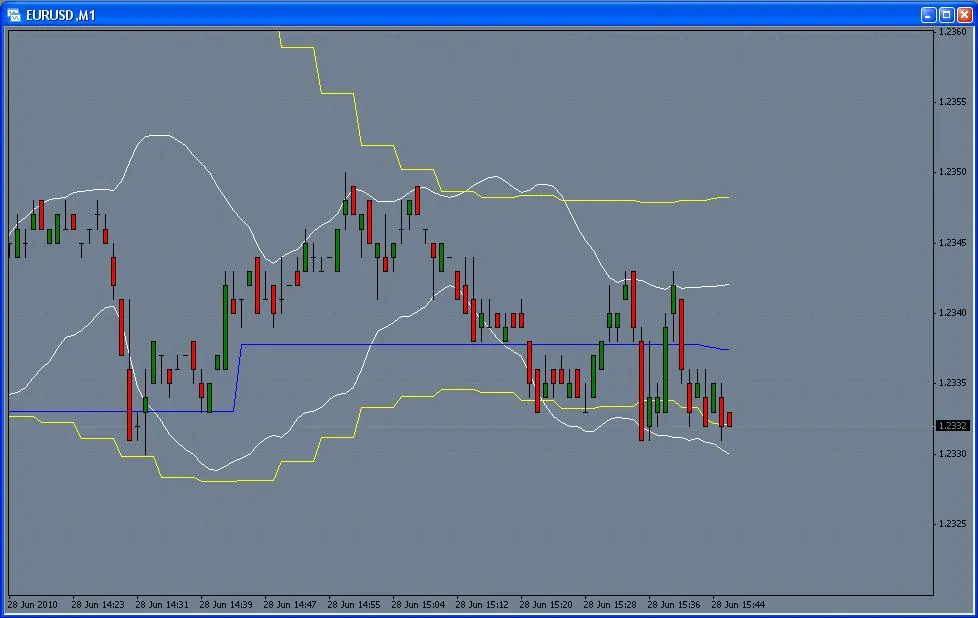
If you're looking to fine-tune your trading strategy on MetaTrader 4, the BB_Support indicator is a tool worth considering. This indicator is designed to help you navigate the market with greater confidence, especially when working within the M1 timeframe. Whether you're trading on M1, M5, H1, or D1, you'll find that the BB_Support indicator can be tailored to fit your needs. Let's dive into what makes this indicator tick! Description: The BB_Support indicator operates effectively on the M1 timeframe. While I personally use periods like M1, M5, H1, and D1, feel free to adjust these settings to match your trading style. Example #1: In the following examples, we utilize the iBands function to set up our upper bands: M1up[i] = iBands(NULL, PERIOD_M1, M1Period, M1Deviation, 0, PRICE_Ma, MODE_UPPER, i); M5up[i] = iBands(NULL, PERIOD_M5, M5Period, M5Deviation, 0, PRICE_Ma, MODE_UPPER, i / PERIOD_M5); M15up[i] = iBands(NULL, PERIOD_M15, M15Period, M15Deviation, 0, PRICE_Ma, MODE_UPPER, i / PERIOD_M15); M30up[i] = iBands(NULL, PERIOD_M30, M30Period, M30Deviation, 0, PRICE_Ma, MODE_UPPER, i / PERIOD_M30); Example #2: Here’s another look with a different setting: M15up[i] = iBands(NULL, PERIOD_M15, H1Period, M15Deviation, 0, PRICE_Ma, MODE_UPPER, i / PERIOD_M15); M30up[i] = iBands(NULL, PERIOD_M30, H1Period, M30Deviation, 0, PRICE_Ma, MODE_UPPER, i / PERIOD_M30); H1up[i] = iBands(NULL, PERIOD_H1, H1Period, H1Deviation, 0, PRICE_Ma, MODE_UPPER, i / PERIOD_H1); H4up[i] = iBands(NULL, PERIOD_H4, H4Period, H4Deviation, 0, PRICE_Ma, MODE_UPPER, i / PERIOD_H4); Images: Feel free to experiment with the BB_Support indicator and see how it can fit into your trading arsenal. Happy trading!

2010.06.29
Unlock Your Trading Potential with the Brooky Minute Overlay Indicator for MetaTrader 4
MetaTrader4
Unlock Your Trading Potential with the Brooky Minute Overlay Indicator for MetaTrader 4

Introducing the Brooky Minute Overlay Indicator This nifty tool is perfect for traders who want to enhance their MetaTrader 4 experience! You can easily drag the Brooky Minute Overlay Indicator over any sub-window indicator without causing any disruptions to their functionality. What’s great about this indicator is its ability to draw vertical lines every hour or at any minute you choose, as long as a candle closes during that timeframe. For instance, you can spot a 27-minute line on a minute chart, but it won’t appear on an M5 chart. However, a 10-minute candle will be visible on both M1 and M5 charts. You following me? This feature is especially handy for those trading M1 and M5 charts. Why is this important? Well, a lot of action tends to unfold just after a candle closes—whether it’s a 5-minute, 15-minute, or even an hourly candle. I personally like to keep an eye on those hourly lines since we all share the same hourly candle, unlike the 4-hour ones. It’s super helpful to gauge where your stochastics, MACD, or other indicators might be, all without needing to toggle between multiple screens. There are some strategies that focus on 10-minute candles and the like; this indicator can really simplify that process. In the example chart, you’ll see an M1 chart featuring Hour, 10-minute, 30-minute, and 45-minute lines. It’s straightforward but surprisingly effective. You have the flexibility to customize the colors, heights, and minute intervals according to your trading style. With this indicator, you can select up to four lines. For example, if you only want to track the hour ending and the 30-minute mark, set the hour selection to 0 minutes and the others to 30 minutes. If you’re feeling adventurous and want to monitor every 3 minutes on an M1 chart, go ahead and overlay a couple of indicators onto your MACD or whatever suits your strategy. Hover your mouse over the line to easily identify which minute line you’re viewing. Happy trading!

2010.06.28
First Previous 334 335 336 337 338 339 340 341 342 343 344 Next Last