Author: HajarWae
If you're diving into the world of trading on MetaTrader 4, understanding RSI (Relative Strength Index) peaks and bottoms is crucial. These indicators can signal potential buy or sell opportunities when the RSI crosses key levels.
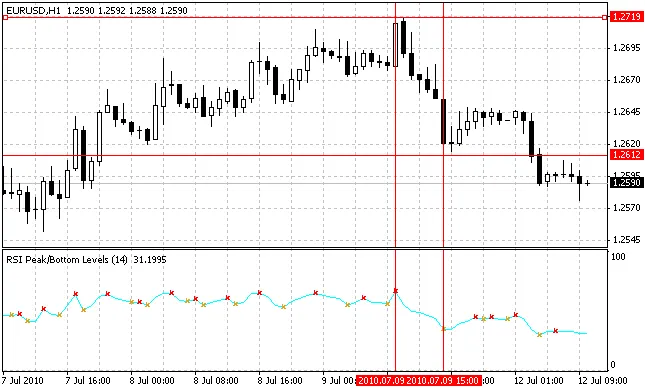
When the RSI hits a peak (marked by a red arrow) or a bottom (indicated by a yellow arrow), it provides early signals for potential market moves. However, it's essential to use additional filters to confirm these signals, so consider combining this method with other indicators to enhance your trading strategy.
I'm working on a project to plot RSI levels based on these peak and bottom positions. I'm running into a bit of a snag with the code needed to modify this indicator, and I could really use some help to perfect it.
The goal is to plot all the peaks and bottoms, allowing us to identify levels at these critical points. When the RSI crosses a peak or bottom line, the level will be marked and terminated one candle after the crossover. The calculations and plotting of other levels will continue until the RSI crosses the levels again.
Can anyone lend a hand? Your insights would be greatly appreciated!
Recommendations:
- Use these RSI levels as trading signals.
- Combine with other indicators as filters for better accuracy.
Related Posts
- Unlocking MetaCOT 2: Your Ultimate CFTC Indicator Toolkit for MT4
- Unlocking the Power of Master Tools for MetaTrader 4
- Unlock Trading Insights with Volume Profile + Range v6.0 for MetaTrader 5
- Mastering the Open Range Breakout Indicator for MetaTrader 5
- How to Use the Change Chart Symbol Menu for MetaTrader 4