Technical Indicator

Unlocking the iUSDx Multicurrency Indicator for MetaTrader 5
MetaTrader5
Unlocking the iUSDx Multicurrency Indicator for MetaTrader 5

If you're trading in the Forex market, you know how crucial it is to monitor the performance of the US Dollar against other major currencies. That's where the iUSDx Multicurrency Indicator comes into play! This handy tool measures the US Dollar Index, which tracks the Dollar's value against a basket of currencies, including the Euro (EUR), Japanese Yen (JPY), British Pound (GBP), Canadian Dollar (CAD), Swiss Franc (CHF), and Swedish Krona (SEK). The USDx Index was established back in March 1973, shortly after the end of the Bretton Woods system, with an initial value set at 100.000. Since then, it has seen highs in the mid-160s and lows of 70.698, which was recorded on March 16, 2008—the lowest point since its inception. The composition of this "basket" has only changed once, when several European currencies were replaced by the Euro in 1999. The USDx is updated continuously whenever the Forex markets are open, which is from Sunday evening New York time (early Monday morning in Asia) right through to late Friday afternoon New York time. The formula for calculating the USD Index is as follows: USDx = 50.14348112 * EURUSD^(-0.576) * USDJPY^0.136 * GBPUSD^(-0.119) * USDCAD^0.091 * USDSEK^0.042 * USDCHF^0.036 Key Features of the iUSDx Multicurrency Indicator: Utilizes the MCM Control Panel. Operates in a real multicurrency mode, processing all ticks for each symbol without delays. This means that if a currency pair experiences multiple price changes within a second, all of them will be accounted for. 
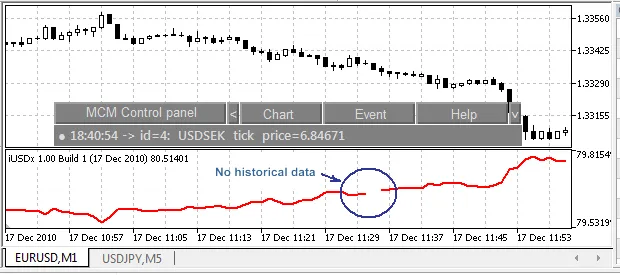
Offers full synchronization across currency pairs. If there's no historical data for a particular pair, the USD index value won’t be computed. Fun fact: The indicator line is drawn whenever new bars appear across all currency pairs! Provides complete control over data synchronization for each currency pair using the "Initialization" event of the MCM Control Panel. This feature saves time when recalculating indicator values, such as during historical data loading. Recalculation will only occur after the "Initialization" event. Utilizes a simpler implementation than methods using OnTick() or OnTimer(), which helps eliminate delays. Allows you to adjust the frequency of indicator recalculations on the fly. For instance, if you're working on an hourly chart, you don’t need to recalculate with every tick. You can set events in the MCM Control Panel (such as one minute, five minutes, or hourly). However, I recommend sticking with the "new tick" events due to the necessity of repeating historical data requests. Installation Steps: Download the "MCM Control Panel for Multicurrency Expert Advisors and Indicators and compile the files "iControl panel MCM.mq5" and "Spy Control panel MCM.mq5". Ensure that the symbols in Market Watch are ordered as follows: EURUSD, USDJPY, GBPUSD, USDCAD, USDSEK, USDCHF. The order of symbols in Market Watch is essential for correct Index calculation. Unzip the iUSDx.zip file into the /MQL5 folder. Then, attach the iUSDx from /MQL5/Indicators/iUSDx/ to a chart, such as EURUSD M1. Next, configure the events in the MCM Control Panel: Set the New tick event for all symbols as outlined here. Also, add a New bar event for EURUSD M1 to ensure proper synchronization when a new bar appears on this timeframe. And that's it! Enjoy trading with the iUSDx Indicator. If you encounter any bugs, feel free to send me a private message.

2010.12.24
Unlocking Market Trends: The OBTR Indicator for MetaTrader 4
MetaTrader4
Unlocking Market Trends: The OBTR Indicator for MetaTrader 4

Hey fellow traders! Today, I want to introduce you to an interesting tool that can enhance your trading strategies – the OBTR (On Balance True Range) indicator, which was conceptualized by Tom Bierovic. This nifty indicator addresses some of the limitations associated with the traditional volume indicator. After scouring the internet for an MT4 version without any luck, I decided to create this indicator myself. And let me tell you, it’s packed with features that can be customized to fit a variety of trading strategies. One of the standout features of the OBTR is how well it complements other standard indicators. It’s especially effective when used alongside MACD signals and a 9 EMA smooth of the OBTR. Now, let’s break down some key settings: The proximity parameter is crucial. This setting determines how close the OBTR line needs to be to the Slow MA (moving average) before a crossover signal appears. For example, if you set it to 11 pips, it will gray out a range of 22 pips. This can serve as a breakout point. Conversely, a smaller value might indicate the end of a retracement in a trend. The maximum setting allows you to gray out areas where the difference between the MA and the OBTR exceeds your specified value. For instance, if you set it to 126 pips, this might indicate a potential exhaustion point for a breakout, making it a good time to take profits. Here are some basic rules to keep in mind: Gray: If the MA is close to the OBTR, look for a breakout or trend continuation. Gray: If the MA is far from the OBTR, consider taking profits or reversing your position. Blue: This signals a good opportunity to go long. Orange: Look for reasons to short. It’s important to note that the Slow MA is represented by a tri-color line. If the line is gray for over two bars while not being lime or red, it may indicate the end of an upswing in a downtrend. I hope this OBTR indicator becomes a valuable addition to your trading toolbox! Cheers,Brooky

2010.12.21
Unlocking the Average Sentiment Oscillator for Better Trading Insights
MetaTrader4
Unlocking the Average Sentiment Oscillator for Better Trading Insights

Average Sentiment Oscillator Are you looking for a way to better gauge market sentiment? The Average Sentiment Oscillator (ASO) is a momentum indicator that analyzes the average percentage of bullish versus bearish sentiment in the market. This tool builds on the formula we developed for the sentiment meter within FX Multimeter III, making it a handy resource for traders. Whether you want to filter trends or find optimal entry and exit points, the ASO can be a valuable addition to your trading toolkit. The ASO combines two algorithms that essentially perform the same task but in different ways. The first algorithm assesses the bullish or bearish sentiment of each bar using Open, High, Low, and Close (OHLC) prices, averaging the percentages across a specified number of bars (for instance, 10). The second algorithm treats the group of bars as a single unit and calculates the sentiment percentage based on the OHLC points of that group. While the first method is a bit noisy, it offers a more accurate intra-bar sentiment reading. In contrast, the second method provides a smoother result, weighing the overall price movement range. You can choose to use them separately as Mode 1 and Mode 2, or combine them for a balanced approach in Mode 0. Mode 1 - Intra-bar algorithm only - Leading Mode 2 - Group algorithm only - Lagging When combining both algorithms, you get the default Mode 0 setup: Mode 0 - Both algorithms - Balanced How to Use the Average Sentiment Oscillator: The blue line represents the percentage of bulls, while the red line indicates the bears. Because both lines are percentages of 100, they mirror each other. The higher line signifies the prevailing sentiment. When the lines cross the 50% centerline, it marks a shift in power between bulls and bears, often signaling a good moment to enter or exit trades. For instance, if the blue line closes above 50% on the last bar, consider buying or exiting a sell position. Conversely, if the red line closes above 50%, it might be time to sell or exit a buy position. These signals tend to be more reliable when average trading volume is high. You can also assess the strength of trends; for example, if the blue peaks are higher than preceding red peaks, that indicates bullish strength. A divergence in the oscillator can show a weakening trend, even when prices are rising. By setting levels at 70% and 30%, you can use the oscillator for identifying overbought or oversold conditions, similar to Stochastic or RSI indicators. As with most indicators, using a shorter period generates more leading signals, while a longer period reduces false signals. If you want to increase the oscillator's range, consider adjusting the fixed minimum and maximum values to 20 and 80, respectively. You can also hide either of the lines within the settings if desired. Check out our website for more tools: www.fxtools.info UPDATE: We fixed a code error in the initial upload. Thank you for your patience!

2010.12.15
First Previous 329 330 331 332 333 334 335 336 337 338 339 Next Last