Technical Indicator

Understanding the Stochastic Momentum Oscillator: A Trader's Guide
MetaTrader5
Understanding the Stochastic Momentum Oscillator: A Trader's Guide

Author: Andrey N. Bolkonsky The Stochastic Momentum Oscillator (SMO), created by William Blau, is a powerful tool for traders looking to enhance their technical analysis. It's built upon the Stochastic Momentum Index, which you can learn more about in the insightful book Momentum, Direction, and Divergence: Applying the Latest Momentum Indicators for Technical Analysis. Ensure that WilliamBlau.mqh is placed in terminal_data_folder\MQL5\Include\ Place Blau_SM_Stochastic.mq5 in terminal_data_folder\MQL5\Indicators\ Stochastic Momentum Oscillator Calculation: The Stochastic Momentum Oscillator is calculated using the following formulas: SM_Stochastic(price,q,r,s,u) = SMI(price,q,r,s,u)SignalLine(price,q,r,s,u,ul) = EMA(SM_Stochastic(price,q,r,s,u),ul) Where: SM_Stochastic() - Represents the Stochastic Momentum Index SMI(price,q,r,s,u); SignalLine() - This is the Signal Line, which is an exponentially smoothed moving average applied to the Stochastic Momentum Index; ul - This is the period for EMA smoothing of the Signal Line. Input Parameters: Graphic Plot #0 - Stochastic Momentum Index: q - Period of Stochastic Momentum (default is q=5); r - Period of the first EMA applied to Stochastic Momentum (default is r=20); s - Period of the second EMA applied to the result of the first smoothing (default is s=5); u - Period of the third EMA applied to the result of the second smoothing (default is u=3); Graphic Plot #1 - Signal Line: ul - Period of EMA smoothing of the Signal Line, applied to the Stochastic Momentum Index (default is ul=3); AppliedPrice - This indicates the price type (default is AppliedPrice=PRICE_CLOSE). Note: q must be greater than 0; r, s, and u must also be greater than 0. If r, s, or u equals 1, no smoothing is applied; ul must be greater than 0. If ul equals 1, the Signal Line and Stochastic Momentum Index will be identical; Minimum rates = (q - 1 + r + s + u + ul - 4 + 1).

2011.06.28
Unlocking the Stochastic Momentum Index (Blau_SMI) for MetaTrader 5: A Trader's Guide
MetaTrader5
Unlocking the Stochastic Momentum Index (Blau_SMI) for MetaTrader 5: A Trader's Guide

Author: Andrey N. Bolkonsky The Stochastic Momentum Index (SMI), created by William Blau, is a powerful tool for traders who want to analyze market momentum effectively. This indicator is based on the Stochastic Momentum Indicator, which you can dive deeper into by checking out Momentum, Direction, and Divergence: Applying the Latest Momentum Indicators for Technical Analysis. The SMI is normalized to half of the q-period price range and scaled within the [–100,+100] interval. Traders interpret SMI values as indicators of market conditions: positive values suggest overbought conditions, while negative values indicate oversold states. Place WilliamBlau.mqh in terminal_data_folder\MQL5\Include\ Place Blau_SMI.mq5 in terminal_data_folder\MQL5\Indicators\ How the SMI is Calculated: The calculation for the Stochastic Momentum Index is as follows:                               100*EMA(EMA(EMA( price-1/2*[LL(q)+HH(q)] ,r),s),u)                  100 * SM(price,q,r,s,u)SMI(price,q,r,s,u) = --------------------------------------------------------------- = -------------------------------------------------                                       EMA(EMA(EMA( 1/2*[HH(q)-LL(q)] ,r),s),u)            EMA(EMA(EMA( 1/2*[HH(q)-LL(q)] ,r),s),u) Where: price - close price; LL(q) - minimum price over the last q bars; HH(q) - maximum price over the last q bars; sm(price,q)=price-1/2*[LL(q)+HH(q)] - q-period Stochastic Momentum; SM(price,q,r,s,u) - triple smoothed q-period Stochastic Momentum; HH(q)-LL(q) - the price range over the last q bars; 1/2*[LL(q)+HH(q)] - midpoint of the q-period price range; 1/2*[HH(q)-LL(q)] - half of the q-period price range; EMA(...,r) - first smoothing using the exponentially smoothed moving average with period r, applied to: the Stochastic Momentum; half of the q-period price range; EMA(EMA(...,r),s) - second smoothing using EMA of period s, applied to the result of the first smoothing; EMA(EMA(EMA(...,r),s),u) - third smoothing using EMA of period u, applied to the result of the second smoothing. Input Parameters: q - period used for the calculation of Stochastic Momentum (default q=5); r - period of the first EMA applied to stochastic (default r=20); s - period of the second EMA applied to the result of the first smoothing (default s=5); u - period of the third EMA applied to the result of the second smoothing (default u=3); AppliedPrice - price type (default AppliedPrice=PRICE_CLOSE). Important Notes: Ensure that q > 0; r > 0, s > 0, u > 0. If r, s, or u = 1, smoothing is not applied; Minimum rates = (q - 1 + r + s + u - 3 + 1).

2011.06.28
Mastering the Stochastic Momentum Indicator for MetaTrader 5
MetaTrader5
Mastering the Stochastic Momentum Indicator for MetaTrader 5

Author: Andrey N. Bolkonsky The Stochastic Momentum Indicator (SM) created by William Blau is a key tool for technical analysis. You can dive deeper into his methods in his book, Momentum, Direction, and Divergence. This indicator measures the distance of the current closing price from the midpoint of a specified range of bars, known as the q-period. Stochastic Momentum Value: This indicates how far the current price is from the midpoint of the q-period price range. Sign of Stochastic Momentum: Positive values suggest the price is above the midpoint, while negative values indicate it's below. Definition of Stochastic Momentum by William Blau Make sure to place WilliamBlau.mqh in terminal_data_folder/MQL5/Include/ Put Blau_SM.mq5 in terminal_data_folder/MQL5/Indicators/ Calculation: The q-period Stochastic Momentum is calculated using the following formula: sm(price,q) = price - 1/2 * [LL(q) + HH(q)] Where: price: The closing price. q: The number of bars used for the Stochastic Momentum calculation. LL(q): The lowest price over the q bars. HH(q): The highest price over the q bars. 1/2 * [LL(q) + HH(q)]: This represents the midpoint of the q-period price range. The smoothed q-period Stochastic Momentum is calculated using: SM(price,q,r,s,u) = EMA(EMA(EMA(sm(price,q),r),s),u) Where: price: The closing price. q: The number of bars for Stochastic Momentum. sm(price,q): The q-period Stochastic Momentum. EMA(sm(price,q),r): The first smoothing using an exponential moving average over period r. EMA(EMA(...,r),s): The second smoothing using an EMA over period s. EMA(EMA(EMA(sm(q),r),s),u): The third smoothing using an EMA over period u. Input parameters: q: Period of Stochastic Momentum (default q=5). r: Period of the first EMA (default r=20). s: Period of the second EMA (default s=5). u: Period of the third EMA (default u=3). AppliedPrice: Type of price used (default AppliedPrice=PRICE_CLOSE). Note: q must be greater than 0. r, s, and u must also be greater than 0. If r, s, or u equals 1, smoothing is not applied. Minimum rates = (q-1+r+s+u-3+1).

2011.06.28
Mastering the Stochastic Oscillator: Your Guide to Blau's Indicator for MetaTrader 5
MetaTrader5
Mastering the Stochastic Oscillator: Your Guide to Blau's Indicator for MetaTrader 5

Author: Andrey N. Bolkonsky The Stochastic Oscillator is a powerful tool based on the Stochastic Index developed by William Blau. If you're looking to deepen your trading strategies, you might want to check out his work in Momentum, Direction, and Divergence. To use this indicator, make sure to place WilliamBlau.mqh in your terminal_data_folder\MQL5\Include\ directory. Additionally, Blau_TS_Stochastic.mq5 needs to go in your terminal_data_folder\MQL5\Indicators\ folder. Stochastic Oscillator by William Blau How It's Calculated: The Stochastic Oscillator is calculated as follows: TS_Stochastic(price,q,r,s,u) = TStochI(price,q,r,s,u) The Signal line is determined through smoothing: SignalLine(price,q,r,s,u,ul) = EMA(TS_Stochastic(price,q,r,s,u) ,ul) where: TS_Stochastic() - This represents the Fast Stochastic, %k - Stochastic Index TStochI(price,q,r,s,u); SignalLine() - This is the Slow Stochastic (the Signal Line), %d, which is an exponentially smoothed moving average applied to the Fast Stochastic (%k) with a period of ul; ul - This is the EMA smoothing period for the Signal Line. Input Parameters: Graphic Plot #0 - Fast Stochastic (Stochastic Index), %k: q - This is the period of Stochastic (default is q=5); r - This is the period of the 1st EMA applied to Stochastic (default is r=20); s - This is the period of the 2nd EMA smoothing applied to the result of the 1st smoothing (default is s=5); u - This is the period of the 3rd EMA smoothing applied to the result of the 2nd smoothing (default is u=3); Graphic Plot #1 - Slow Stochastic (Signal Line), %d: ul - This is the period of EMA smoothing (signal line) applied to Fast Stochastic (default is ul=3); AppliedPrice - This refers to the type of price applied (default is AppliedPrice=PRICE_CLOSE). Important Notes: q must be greater than 0; r, s, and u must also be greater than 0. If r, s, or u = 1, smoothing is not applied; ul must be greater than 0. If ul = 1, the oscillator and signal lines will be identical; Minimum rates = (q-1 + r + s + u - 3 + 1).

2011.06.24
Understanding the Stochastic Index: A Deep Dive into Blau_TStochI for MetaTrader 5
MetaTrader5
Understanding the Stochastic Index: A Deep Dive into Blau_TStochI for MetaTrader 5

Author: Andrey N. Bolkonsky The Stochastic Index, a normalized smoothed q-period Stochastic developed by William Blau, is detailed in his book Momentum, Direction, and Divergence: Applying the Latest Momentum Indicators for Technical Analysis. This indicator normalizes the values of the q-period smoothed Stochastic, mapping them into a range between [0, +100]. This makes it an effective tool for identifying overbought or oversold conditions in the market. Make sure to place WilliamBlau.mqh in your terminal_data_folder\MQL5\Include\ Place Blau_TStochI.mq5 in your terminal_data_folder\MQL5\Indicators\ Stochastic Index Indicator by William Blau Calculation: The Stochastic Index Indicator is calculated using the following formula: 100 * EMA(EMA(EMA( price-LL(q) ,r),s),u) TStochI(price,q,r,s,u) = ------------------------------------------------- 100 * TStoch(price,q,r,s,u) EMA(EMA(EMA( HH(q)-LL(q) ,r),s),u) Where: price - close price; q - number of bars used in the calculation; LL(q) - lowest price over the q bars; HH(q) - highest price over the q bars; stoch(q)=price-LL(q) - q-period Stochastic; TStoch(price,q,r,s,u) - triple smoothed q-period Stochastic; HH(q)-LL(q) - q-period price range; EMA(...,r) - first smoothing using the exponentially smoothed moving average with period r, applied to: q-period Stochastic; q-period Price Range; EMA(EMA(...,r),s) - 2nd smoothing: EMA of period s applied to the result of the 1st smoothing; EMA(EMA(EMA(...,r),s),u) - 3rd smoothing: EMA of period u applied to the result of the 2nd smoothing. If EMA(EMA(EMA(HH(q)-LL(q),r),s),u)=0, then TStochI(price,q,r,s,u)=0. Input Parameters: q - period used for the calculation of Stochastic (default is q=5); r - period of the 1st EMA applied to Stochastic (default is r=20); s - period of the 2nd EMA applied to the result of the 1st smoothing (default is s=5); u - period of the 3rd EMA applied to the result of the 2nd smoothing (default is u=3); AppliedPrice - price type (default is AppliedPrice=PRICE_CLOSE). Note: q>0; r>0, s>0, u>0. If r, s, or u =1, smoothing is not applied; Minimum rates = (q-1+r+s+u-3+1).

2011.06.24
Understanding the Blau_TStoch Indicator for MetaTrader 5
MetaTrader5
Understanding the Blau_TStoch Indicator for MetaTrader 5

Author: Andrey N. Bolkonsky If you’re diving into the world of trading, the Stochastic Indicator, particularly the smoothed q-period Stochastic developed by William Blau, is a tool you should consider adding to your arsenal. This indicator is based on the traditional Stochastic Indicator (check out the book Momentum, Direction, and Divergence for deeper insights). The Blau_TStoch displays how far the closing price is from the lowest price over the last q bars. Essentially, it provides a numerical value that indicates the price's position relative to the lowest price in that specific period, with values always being >=0. Make sure to place WilliamBlau.mqh in your terminal_data_folder\MQL5\Include\ Drop Blau_TStoch.mq5 into your terminal_data_folder\MQL5\Indicators\ Stochastic Indicator Blau_TStoch How It Works: The calculation for the q-period Stochastic is straightforward: stoch(price,q) = price - LL(q) Where: price - the closing price of the current timeframe; q - the number of bars used in the Stochastic calculation; LL(q) - the lowest price over those q bars. To get the smoothed q-period Stochastic, you would calculate it like this: TStoch(price,q,r,s,u) = EMA(EMA(EMA( stoch(price,q) ,r),s),u) Where: price - the closing price; q - the number of bars for the Stochastic calculation; stoch(price,q) - the q-period Stochastic; EMA(stoch(price,q),r) - 1st smoothing via exponentially smoothed moving average (EMA) over period r; EMA(EMA(...,r),s) - 2nd smoothing applying EMA over period s; EMA(EMA(EMA(...,r),s),u) - 3rd smoothing with EMA over period u. Input Parameters: q - period for Stochastic calculation (default is q=5); r - period for the 1st EMA (default is r=20); s - period for the 2nd EMA (default is s=5); u - period for the 3rd EMA (default is u=3); AppliedPrice - the type of price used (default is AppliedPrice=PRICE_CLOSE). Important Notes: Ensure q > 0; Make sure r > 0, s > 0, and u > 0. If any of r, s, or u equal 1, smoothing won't be applied; Minimum rates = (q-1+r+s+u-3+1).

2011.06.24
Mastering the Blau Ergodic Oscillator: A Comprehensive Guide for Traders
MetaTrader5
Mastering the Blau Ergodic Oscillator: A Comprehensive Guide for Traders

Author: Andrey N. Bolkonsky The Blau Ergodic Oscillator, developed by William Blau, is a powerful tool based on the True Strength Index (TSI). If you're interested in diving deeper, check out the book Momentum, Direction, and Divergence: Applying the Latest Momentum Indicators for Technical Analysis. 
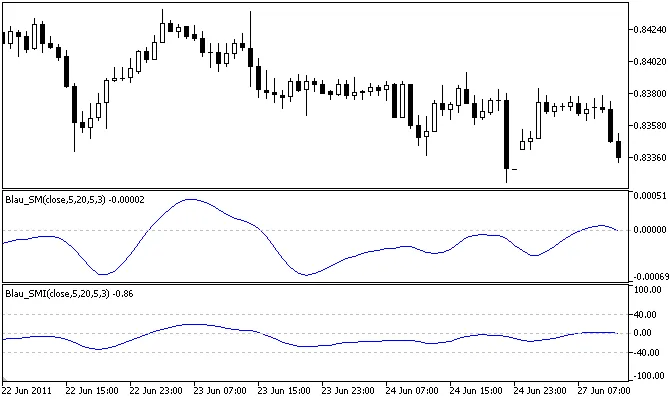
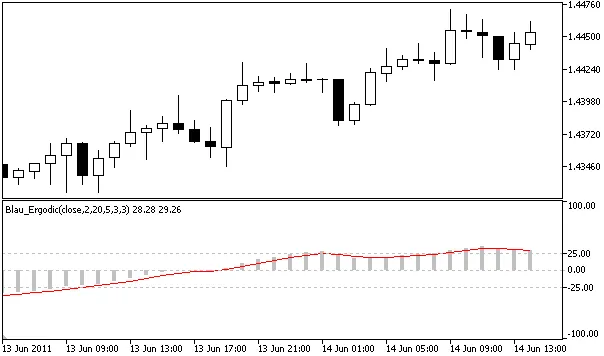
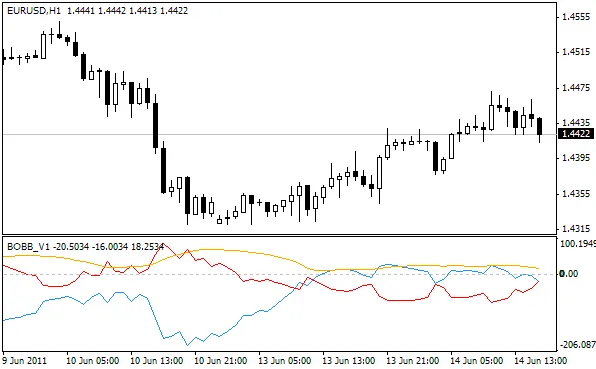
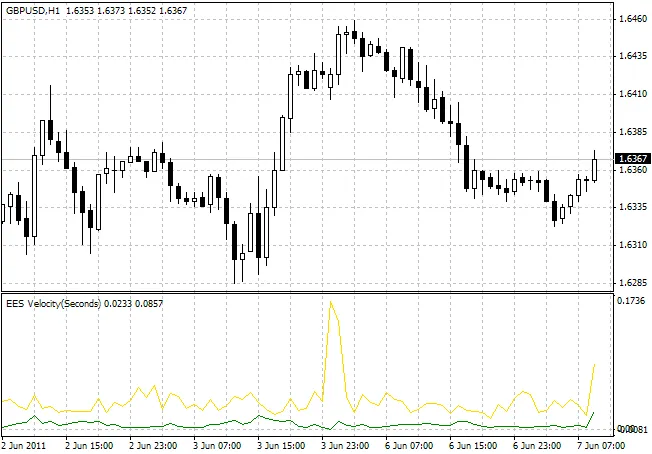
One of the key features of the Ergodic Oscillator is its signal line, which helps indicate trend reversals. 
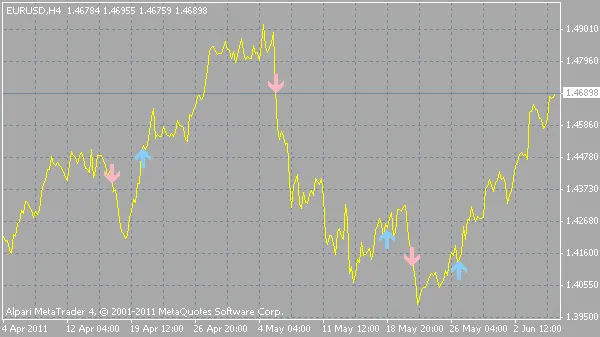
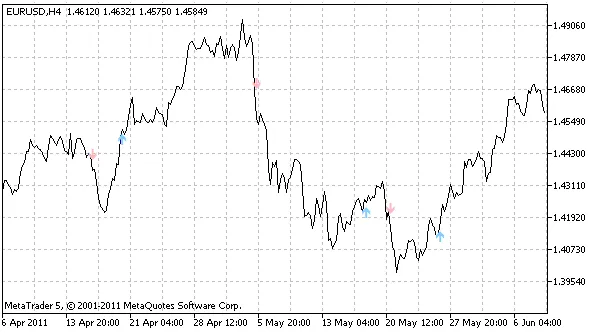
Buy signal: An upward crossover of the signal line. Sell signal: A downward crossover of the signal line. The signal line is derived from smoothing the base line (the Ergodic oscillator or TSI), with its averaging period matching the last averaging period of the base line. When the base line is above the signal line, the trend is considered upward; conversely, when the base line is below the signal line, the trend is downward. Make sure to place WilliamBlau.mqh in your terminal_data_folder/MQL5/Include/ directory. Place Blau_Ergodic.mq5 in your terminal_data_folder/MQL5/Indicators/ directory.
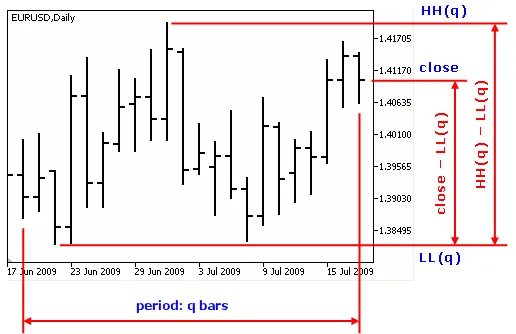
 Calculation: The Ergodic Oscillator is calculated using the following formulas: 
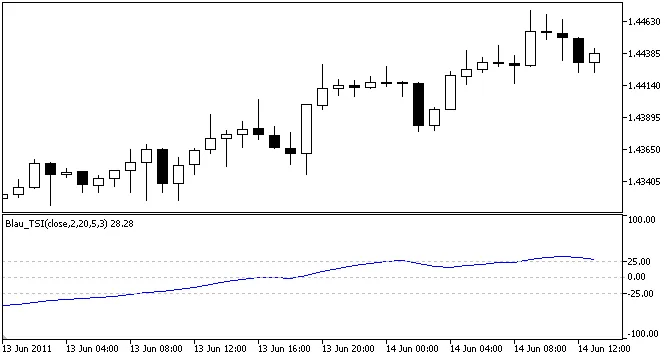
Ergodic(price,q,r,s,u) = TSI(price,q,r,s,u) SignalLine(price,q,r,s,u,ul) = EMA(Ergodic(price,q,r,s,u),ul) Where: Ergodic() - Base line: True Strength Index TSI(price,q,r,s,u); SignalLine() - Signal line: Exponentially smoothed moving average with period ul, applied to Ergodic; ul - Averaging period of the signal line (according to William Blau, it should equal the last averaging period of the Ergodic line, which must be greater than 1). For example, if Ergodic(price,q,r,s,u)=Ergodic(price,2,20,5,1), then ul=s=5. Input Parameters: Graphic Plot #0 - Ergodic (True Strength Index): q - Momentum averaging period (default q=2); r - Period of the 1st EMA applied to Momentum (default r=20); s - Period of the 2nd EMA applied to the result of the first smoothing (default s=5); u - Period of the 3rd EMA applied to the result of the second smoothing (default u=3); Graphic Plot #1 - Signal Line: ul - Smoothing period of the signal line applied to the base line (default ul=3); AppliedPrice - Price type (default AppliedPrice=PRICE_CLOSE). Note: q>0; r>0, s>0, u>0. If r, s, or u =1, smoothing is not used; ul>0. If ul=1, the signal and base lines are identical; Minimum rates = (q-1+r+s+u+ul-4+1).

2011.06.20
Mastering the madnessMA Indicator for MetaTrader 4
MetaTrader4
Mastering the madnessMA Indicator for MetaTrader 4

Hey fellow traders! Today, let's dive into the madnessMA indicator designed for MetaTrader 4. This handy tool calculates the correlation between moving averages (MAs) of different periods, giving you insights that can sharpen your trading strategy. Understanding the Lines Here’s a quick rundown of what the various lines and dots represent: Black/Red dots - Indicate Open/Close signals. If the dots appear above the chart, it’s a BUY signal; if they’re below, it’s a SELL signal. Silver Line - Reflects trend correlation. A value of 100 means all MAs are in an upward trend, while -100 indicates all MAs are in a downward trend. Blue Line - Shows Sort Degree. A value of 100 signifies all MAs are ascending, and -100 means all are descending. Blue Dashed Line - Represents a rough Sort Degree comparing MAcheck, Higher MAs, and Lower MAs. A value of 100 indicates that all Higher MAs are above MAcheck and all Lower MAs are below it. Conversely, -100 suggests a mixed situation where Higher MAs are less than MAcheck, which is in turn less than Lower MAs, indicating no clear order. Parameters Overview The parameters are pretty self-explanatory. Here’s a glimpse: //---- input parameters extern string ________________01="List of MAs, eg from Fibonacci: 0, 1, 1, 2, 3, 5, 8, 13, 21, 34, 55, 89, 144, 233, 377, 610, 987, 1597"; extern string listMA="1, 2, 3, 5, 8, 13, 21, 34, 55, 89, 144, 233"; extern string ________________02="MA to check SORT DEGREE"; extern int MAcheck=8; extern string ________________10="MA sort type"; extern int MAmethod = 1; // iMA moving average method: // 0 Simple moving average, // 1 Exponential moving average, // 2 Smoothed moving average, // 3 Linear weighted moving average. Visual Representation With the madnessMA indicator in your toolkit, you can enhance your trading decisions and stay ahead of the game. Happy trading!

2011.06.20
Unlocking the BOBB Indicator for MetaTrader 4: Your Guide to Trading Breakouts
MetaTrader4
Unlocking the BOBB Indicator for MetaTrader 4: Your Guide to Trading Breakouts

Description: Hey fellow traders! Today, I want to introduce you to an exciting tool for your trading arsenal: the BOBB indicator for MetaTrader 4. My goal was to create an indicator that highlights Bollinger Bands® breakouts while also showcasing the width of those bands. The first version (v1) includes a handy orange line that represents the band width. Here's how it works: when the blue line crosses above the zero line, it's a signal for a bullish breakout. Conversely, if the red line crosses the zero line to the upside, that indicates a bearish breakout. After getting some great signals from the crossover of these two lines, I decided to take it up a notch with a version 2 (v2). This iteration includes the difference between the two lines along with a moving average (MA). The orange line remains the same as in v1. The blue line now shows the difference between the two lines from v1. A crossing below the zero line signals a short position, while a crossing above indicates a long position. The red line represents the moving average. Once I completed the coding, I noticed that the blue line effectively displays the difference between price and the 20-period moving average. Despite this, it generates solid signals whether you're trading based on the zero line crossover or the moving average. Plus, there are some useful divergences to consider! Wishing you all successful trading!

2011.06.15
Mastering MAcrosses: Your Go-To Indicator for MetaTrader 4
MetaTrader4
Mastering MAcrosses: Your Go-To Indicator for MetaTrader 4

Welcome fellow traders! Today, we're diving into the world of MAcrosses, a nifty indicator designed for MetaTrader 4 that helps you analyze moving averages like a pro. What Does MAcrosses Do? This indicator counts the number of crosses off moving averages (MAs) and displays the percentage of all MAs that are above the slower ones. It’s a fantastic tool for gauging market trends. Here's how it works: If a moving average crosses above another, the indicator will rise. If it crosses below, the indicator will fall. When the indicator hits 100%, it means that every MA is above the higher-period MAs. Conversely, when it drops to 0%, every MA is below the higher-period MAs. This can give you a clear picture of market momentum. Setting Up Your MAcrosses Indicator You can customize the maximum MA and the step size between the MAs to suit your trading style: Max MA: This is the maximum moving average you want to consider. MAs Step: This is the gap between the MAs, and a good rule of thumb is to set it at Max MA/10. MA on MAs Crosses: This is the moving average calculated on the main line of MAcrosses. MA Method: Choose your preferred moving average calculation method. Applied to Price: Decide which price data you want the MAs to be based on. Alert: Enable this option to receive alerts when the alert lines cross. Alert Line: You can set this to either Crosses (the main line) or Average (the MA on MAs crosses line). Alert Up Level: This is the level at which you want to receive alerts. Alert Down Level: This is the opposite, indicating the level below which you want alerts. With high values, MAcrosses can be used as a trend indicator, helping you identify strong market movements. On the flip side, with low values, it can serve as an oscillator indicator, providing insights into potential reversals. So, whether you’re looking to ride the trend or catch a reversal, MAcrosses is a versatile tool that can enhance your trading strategy. Happy trading!

2011.06.03
First Previous 324 325 326 327 328 329 330 331 332 333 334 Next Last