MetaTrader5
Unlocking the Candlestick Momentum Index (CMI) for MetaTrader 5
Author: Andrey N. Bolkonsky
The Candlestick Momentum Index (CMI), inspired by the Candlestick Momentum Indicator, is a powerful tool introduced by William Blau in his acclaimed book, "Momentum, Direction, and Divergence: Applying the Latest Momentum Indicators for Technical Analysis".
Make sure to place WilliamBlau.mqh under terminal_data_folder\MQL5\Include\
Put Blau_CMI.mq5 in terminal_data_folder\MQL5\Indicators\
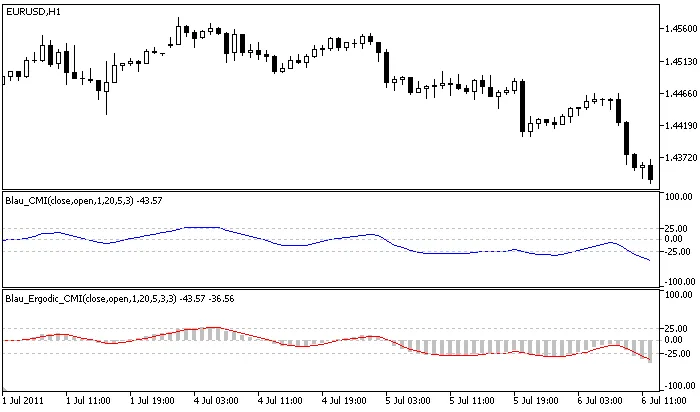
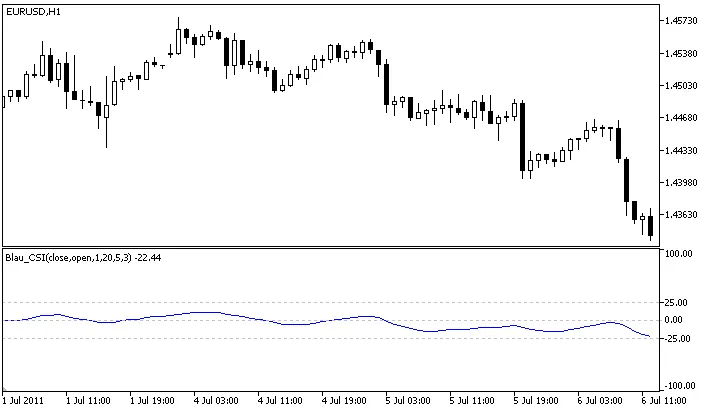
The CMI values are normalized within the range of [-100,+100]. This normalization allows positive CMI values to indicate overbought market conditions, while negative values signal oversold conditions. It’s a nifty way to gauge market sentiment!
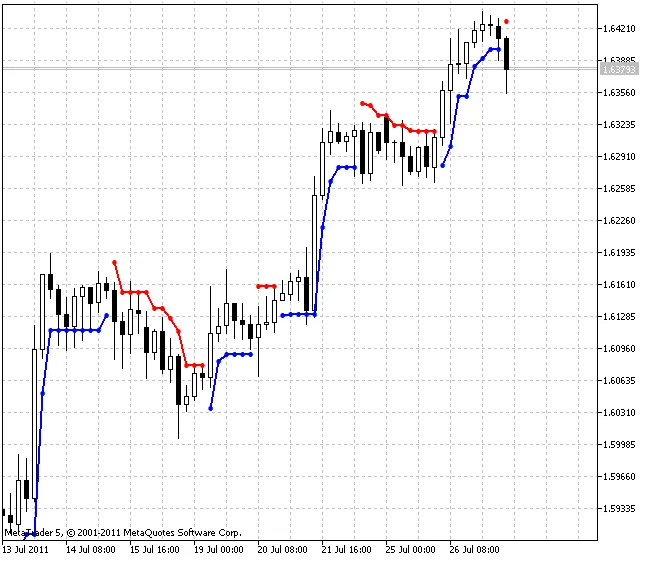
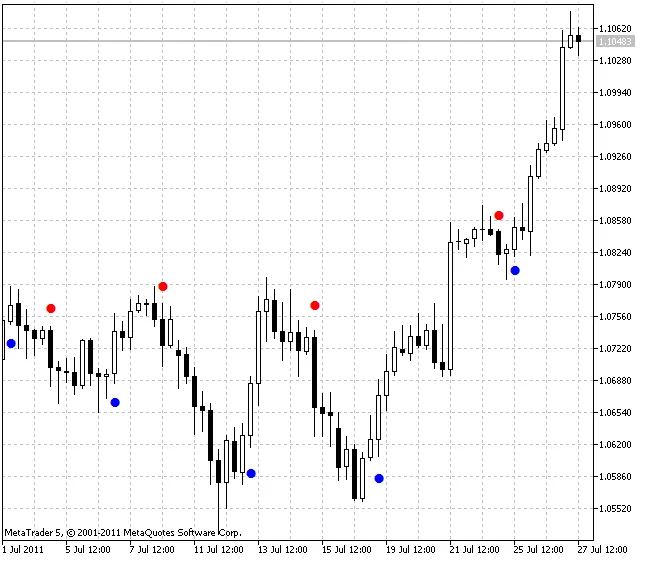
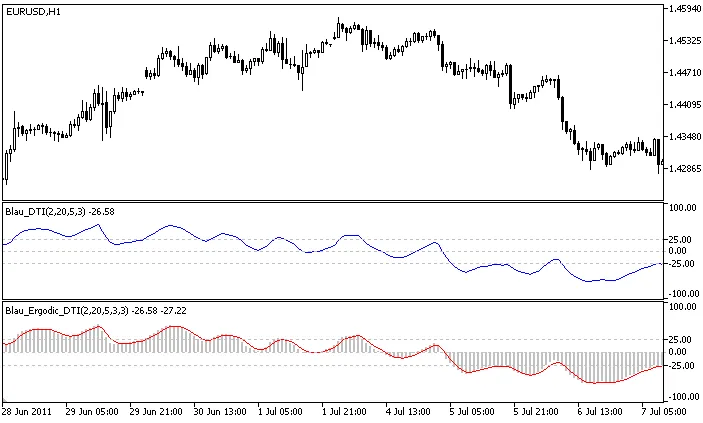
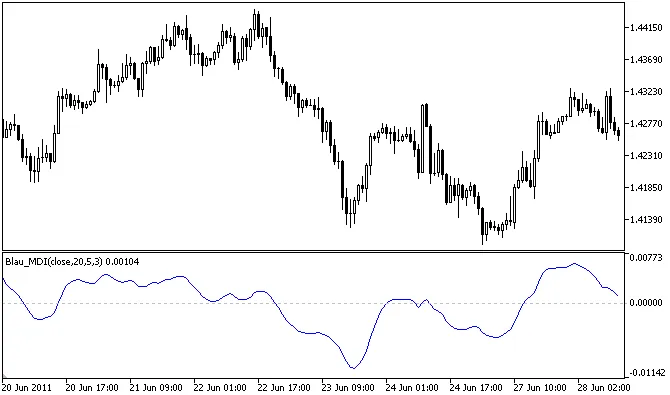
Candlestick Momentum Index
Calculation:
The CMI is calculated using the following formula:
100 * EMA(EMA(EMA(cmtm(price1,price2,q),r),s),u) 100 * CMtm(price1,price2,q,r,s,u)CMI(price1,price2,q,r,s,u) = –––––––––––––––––––––––––––––––––––––––––––– = ––––––––––––––––––––––––––––––––––––––––– EMA(EMA(EMA(|cmtm(price1,price2,q)|,r),s),u) EMA(EMA(EMA(|cmtm(price1,price2,q)|,r),s),u)
if EMA(EMA(EMA(|cmtm(price1,price2,q)|,r),s),u)=0, then CMI(price1,price2,q,r,s,u)=0
Where:
q: Number of bars used to calculate Candlestick Momentum;
price1: Close price;
price2: Open price from q bars ago;
cmtm(price1,price2,q): price1 - price2[q-1] - Candlestick Momentum;
|cmtm(price1,price2,q)|: Absolute value of Candlestick Momentum;
CMtm(price,q,r,s,u): Triple smoothed Candlestick Momentum;
EMA(...,r): First smoothing EMA(r) applied to:
Candlestick Momentum;
Absolute value of Candlestick Momentum;
EMA(EMA(...,r),s): Second smoothing - EMA(s), applied to the result of the first smoothing;
EMA(EMA(EMA(...,r),s),u): Third smoothing - EMA(u), applied to the result of the second smoothing.
Input parameters:
q: Number of bars for Candlestick Momentum calculation (default q=1);
r: Period of the first EMA applied to Candlestick Momentum (default r=20);
s: Period of the second EMA (default s=5);
u: Period of the third EMA (default u=3);
AppliedPrice1: Price type (default AppliedPrice1=PRICE_CLOSE);
AppliedPrice2: Price type (default AppliedPrice2=PRICE_OPEN).
Note:
q > 0;
r > 0, s > 0, u > 0. If r, s, or u are equal to 1, the smoothing is not applied;
Minimum rates = (q-1+r+s+u-3+1).
2011.07.12