If you’re diving into technical analysis, the Twiggs Money Flow (TMF) is a key indicator you’ll want to have in your toolkit. Developed by Colin Twiggs, it utilizes Welles Wilder's Moving Average to help traders gauge market momentum.
This indicator comes with one adjustable parameter:
- Period - This defines the calculation period for the indicator.
Here’s how the calculations break down:
TMF = WMA(ADV) / WMA(Volume)
Where:
WMA - Wilder's Smoothing Average with the smoothing average k = 1/Period
ADV = Volume * (2*Close - TRL - TRH) / TR
TRH = Maximum(High, PrevClose)
TRL = Minimum(Low, PrevClose)
TR = TRH-TRL
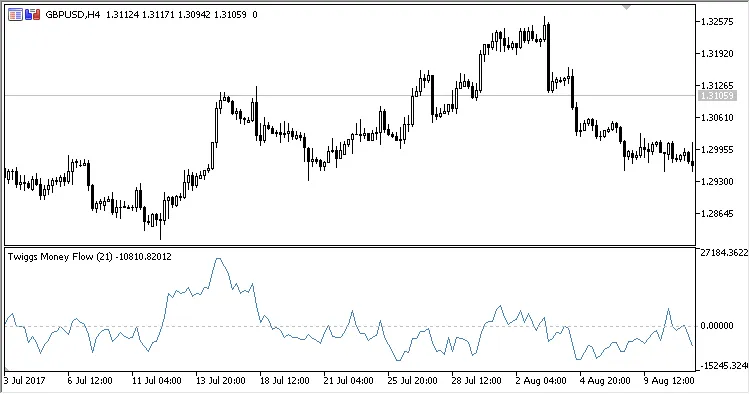
So, how do you interpret the Twiggs Money Flow?
- Positive TMF values indicate a bullish market trend, while negative values suggest a bearish trend.
- The further the TMF moves away from zero (either above or below), the stronger the signal it provides.
- Consider entering a long position when the price breaks above a resistance line and the TMF is above zero.
- For short positions, look for a breakdown below a support line while the TMF remains above zero.
- Divergence between the oscillator and price can also offer valuable signals:
- Go long during a bullish divergence.
- Consider going short in a bearish divergence.
Related Posts
- Unlocking the Power of Master Tools for MetaTrader 4
- Mastering the FE Fibonacci Expansion Indicator for MetaTrader 4
- Visualize Current Trends Across All Time Frames with This MetaTrader 4 Indicator
- Mastering the Fibonacci ZigZag Indicator for MetaTrader 5
- Unlock Trading Potential with the Harami Alert Indicator for MetaTrader 5