Hello Fellow Traders! Today, we’re diving into a fascinating tool for MetaTrader 4 that’s all about ...
Hello fellow traders! This is an exciting update on a trading system that was originally published o...
Latest Updates: Check it out here! Every morning at 7:00 AM GMT, we execute two trades in opposite ...
Hey fellow traders! Today, let’s dive into the world of pivot points and how you can leverage the Pi...
Hey there, fellow traders! Wishing all the best of luck to everyone participating in the Championshi...
Strategy Author: Urban Sotensek. EA Author: Yuriy. ForTrader.ru Last Versions: Check it out here Tr...
If you’re looking to up your trading game, let me introduce you to a powerful MACD Expert Advisor ...
Author: Noam Koren Meet the Kijun Sen Robot: Your new trading ally! This Expert Advisor (EA) le...
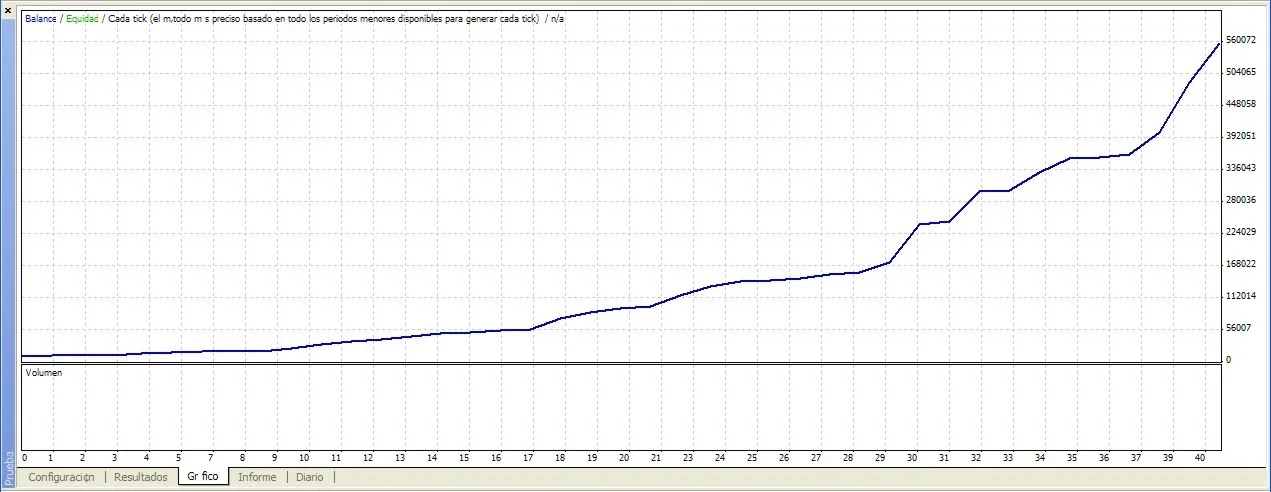
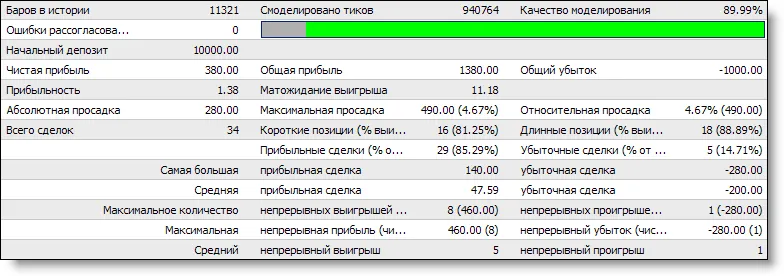
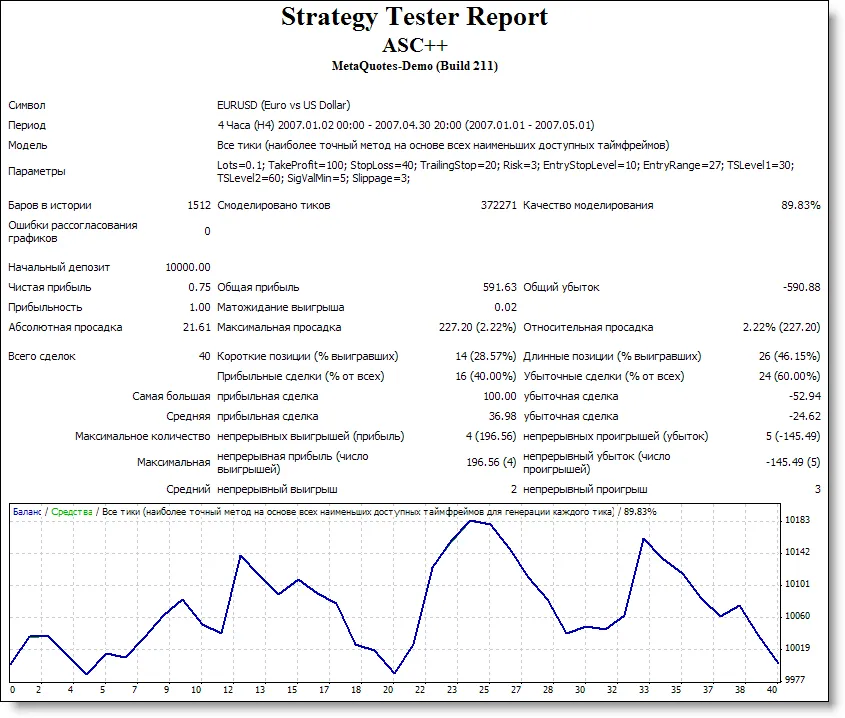
Author: Forex-Experts Let’s dive into the ASC++ Expert Advisor for MetaTrader 4. Heads up: By def...
Why MetaTrader 4 is a Game-Changer for Traders When it comes to trading platforms, MetaTrader 4 (M...
Strategy Author: FXRaider. EA Author: Yuriy. ForTrader.ru Last Versions: Here In this guide, we’ll ...
If you're diving into the world of automated trading, the Brakeout Trader EA for MetaTrader 4 is a t...
Opening and Closing Trades: When it comes to trading, timing is everything! With SimpleTrade, you o...
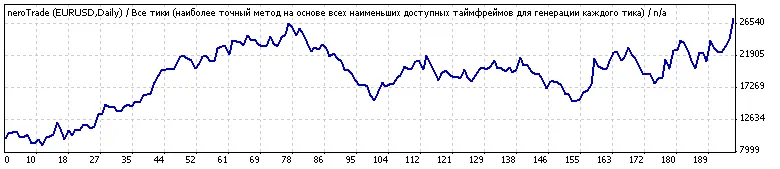
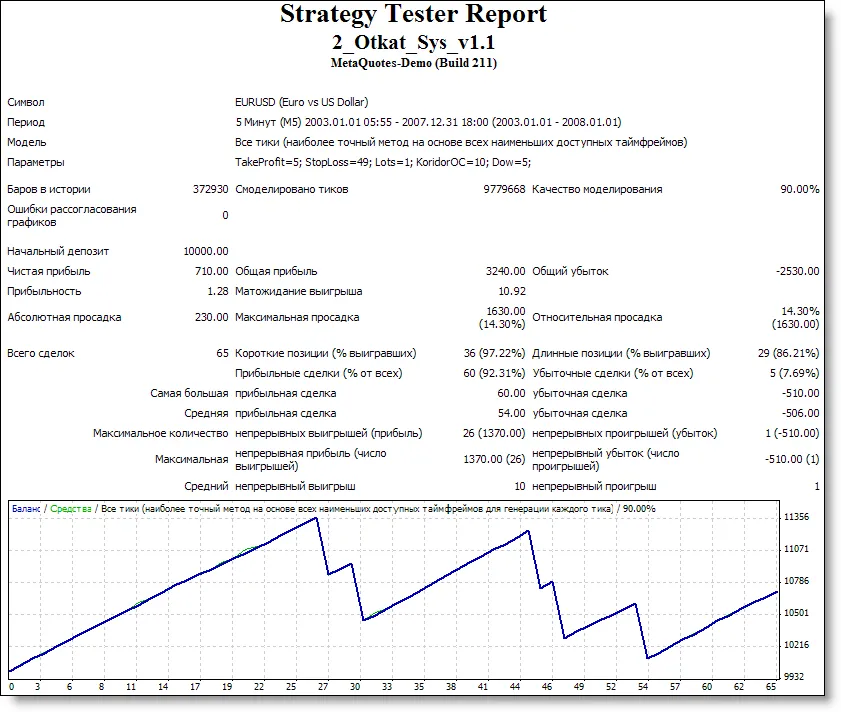
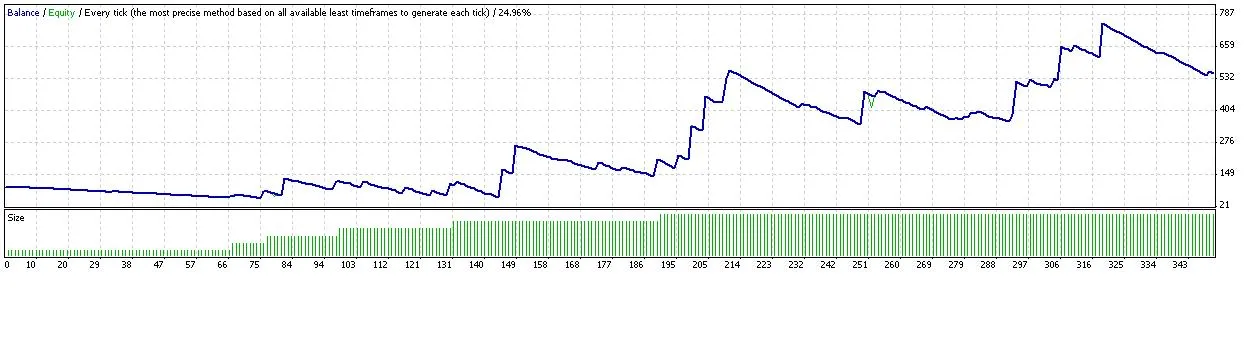
Author: Not specified Introducing the 2_Otkat Sys v1.1 This trading system operates from Thurs...
EUR/USD 1 Minute Strategy: Introducing Rabbit3 Hey traders! If you’ve been testing Rabbit3 live, ...
Check out my experience starting with just £100 using the RabbitM2 system! Performance Report: 22...
Description: Hedge The Hedge Trader is designed to take your hedging game to the next level by ma...
Not too long ago, I shared my insights on the 10 Pips a Day Opposite Yesterday's Trend Expert Adviso...
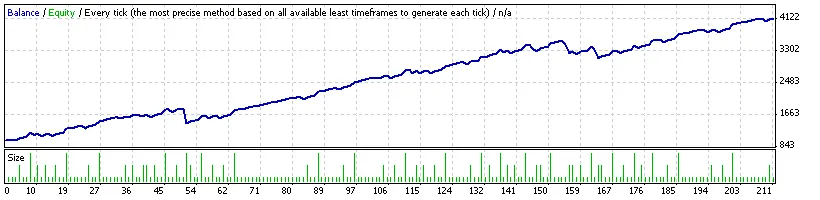
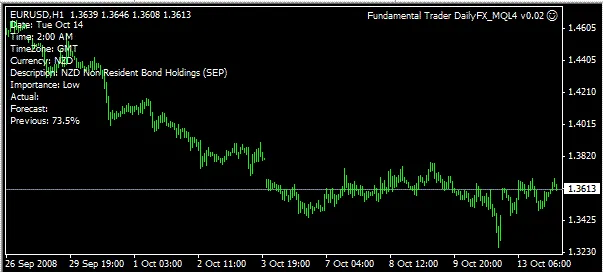
Description: The Fundamental Trader EA is designed to automate trading decisions based on news ...
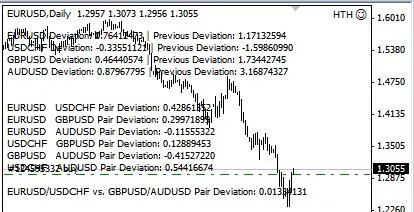
Understanding the EURUSD and USDCHF Hedge Strategy If you’re diving into Forex trading, understandin...