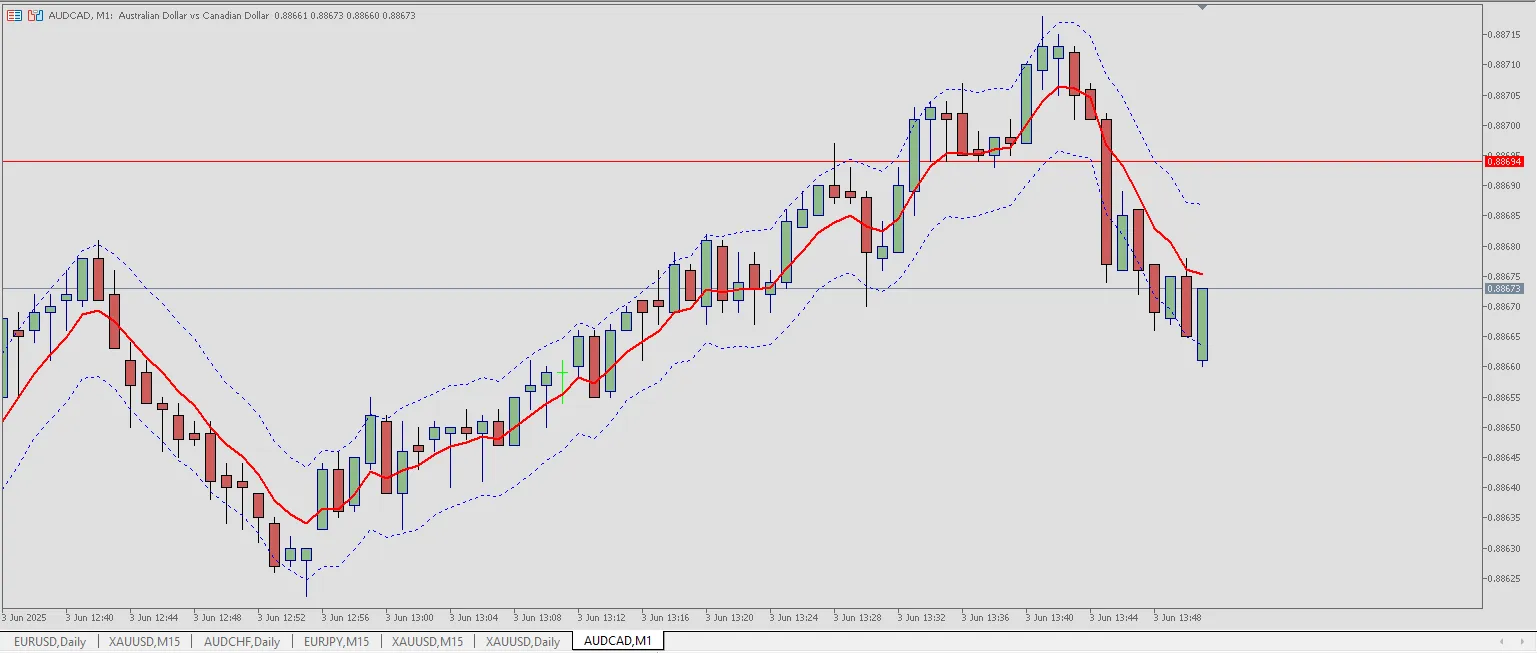
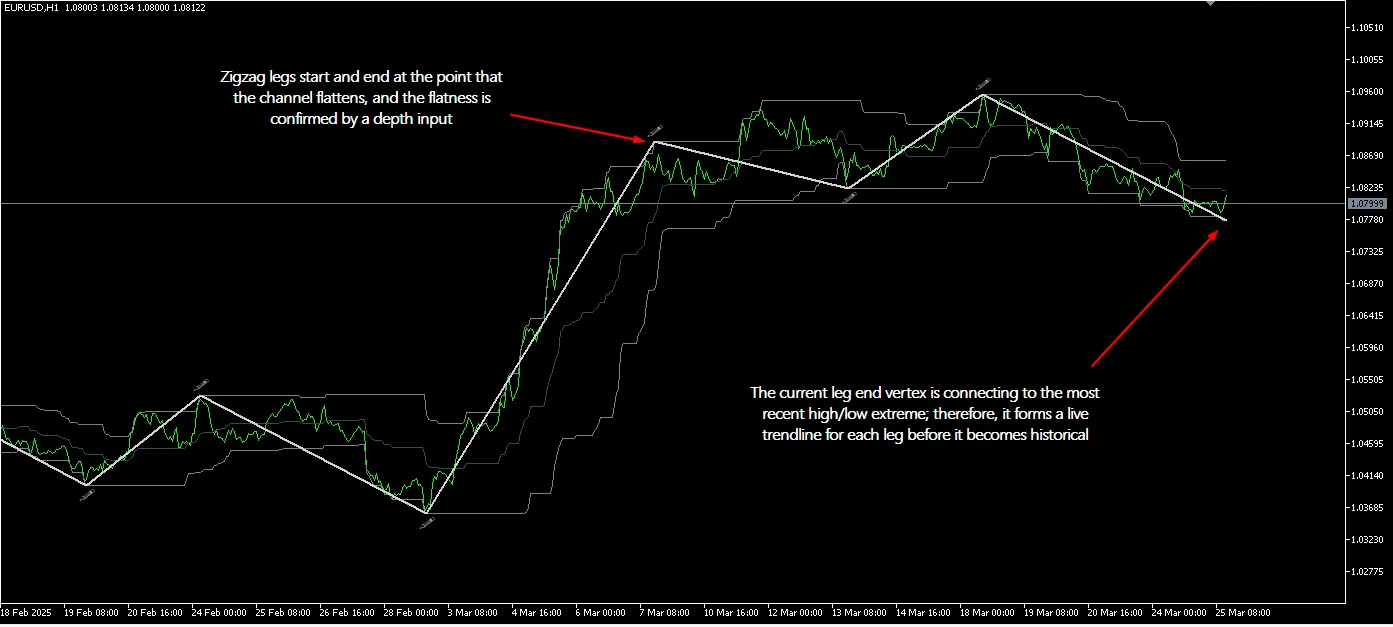
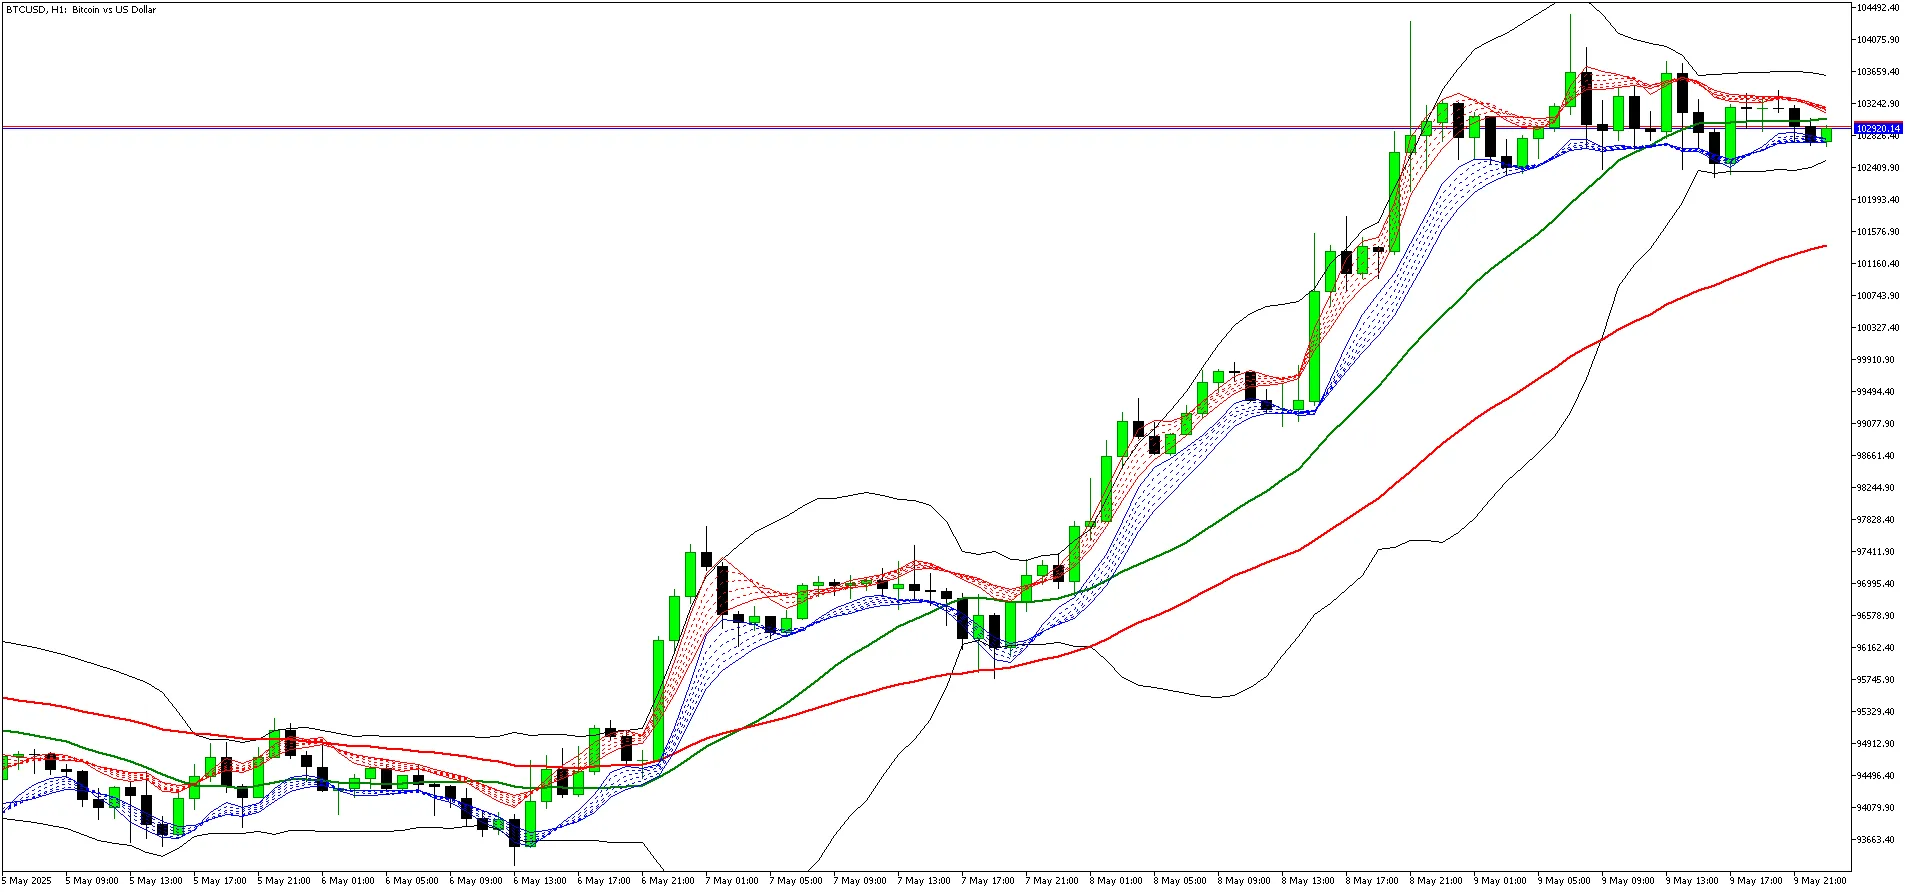
Indicator Name: Baseline: iMA + ATR Bands Description: The Baseline: iMA + ATR Bands is a custom tra...
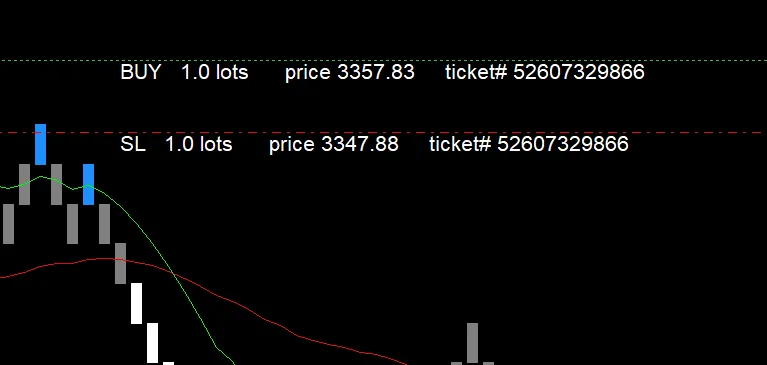
This handy indicator is designed to display labeled trade levels right on any chart you choose. If y...
Exciting news, traders! There’s a new update ready for you. You can download the Double MA with Spe...
Exciting news! We've just rolled out a new update. You can download the Double MA with Special Tim...
Hey fellow traders! If you're looking to enhance your trading toolkit, you might want to check out t...
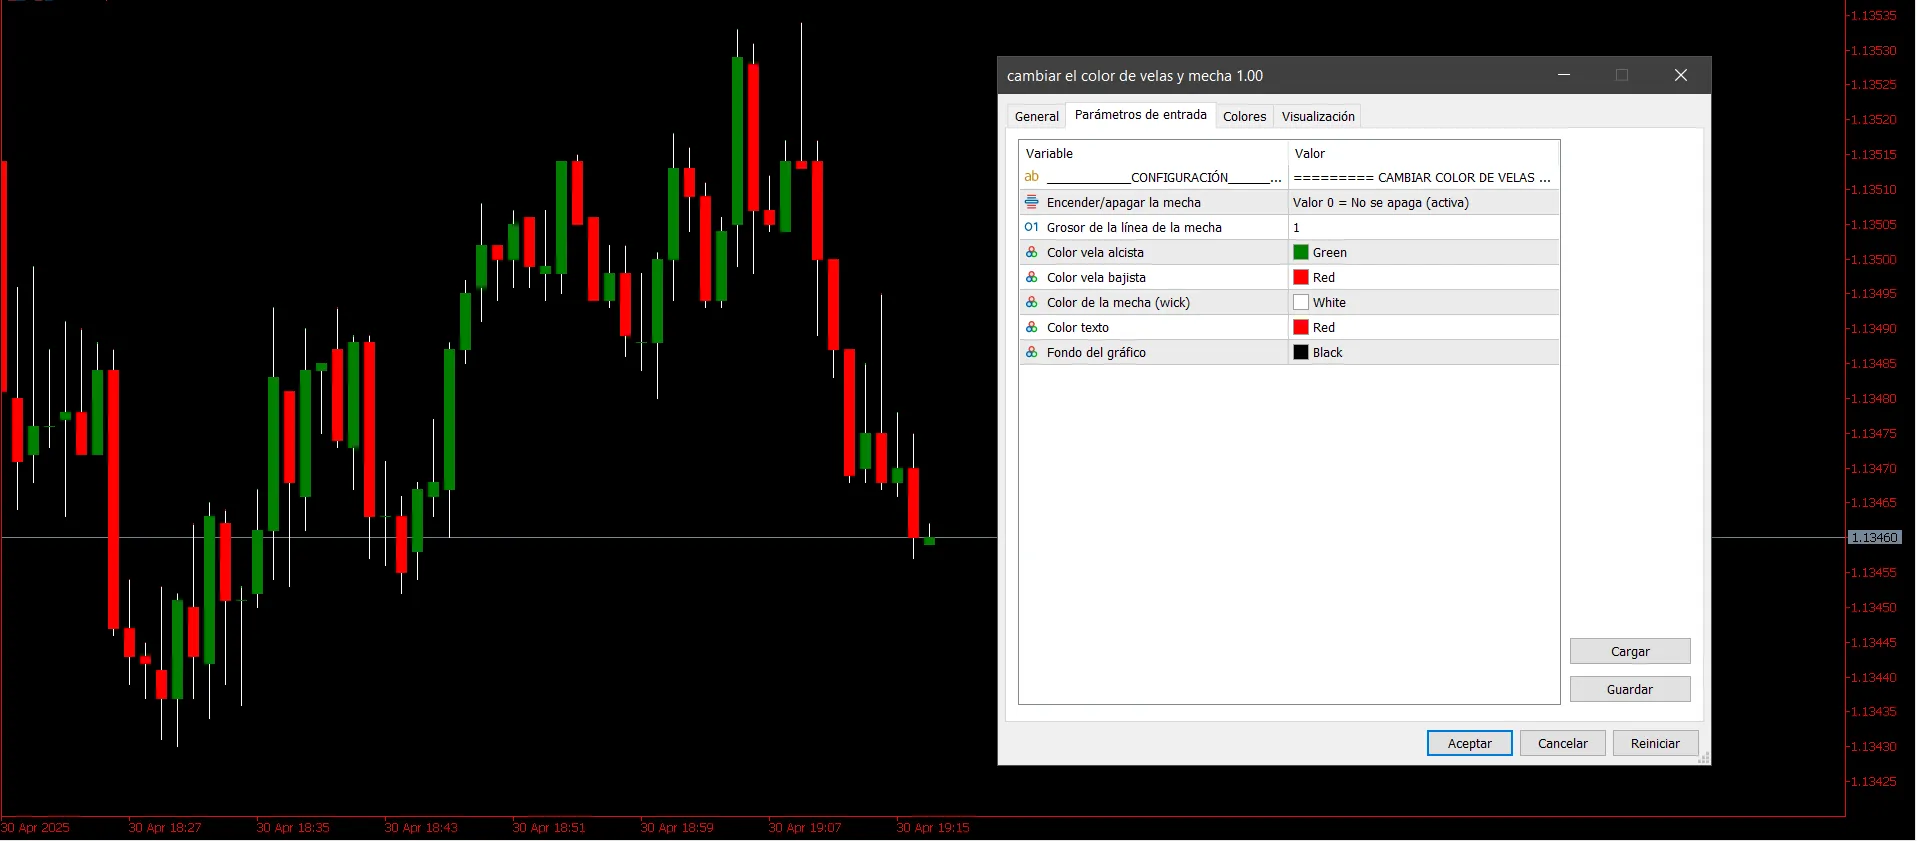
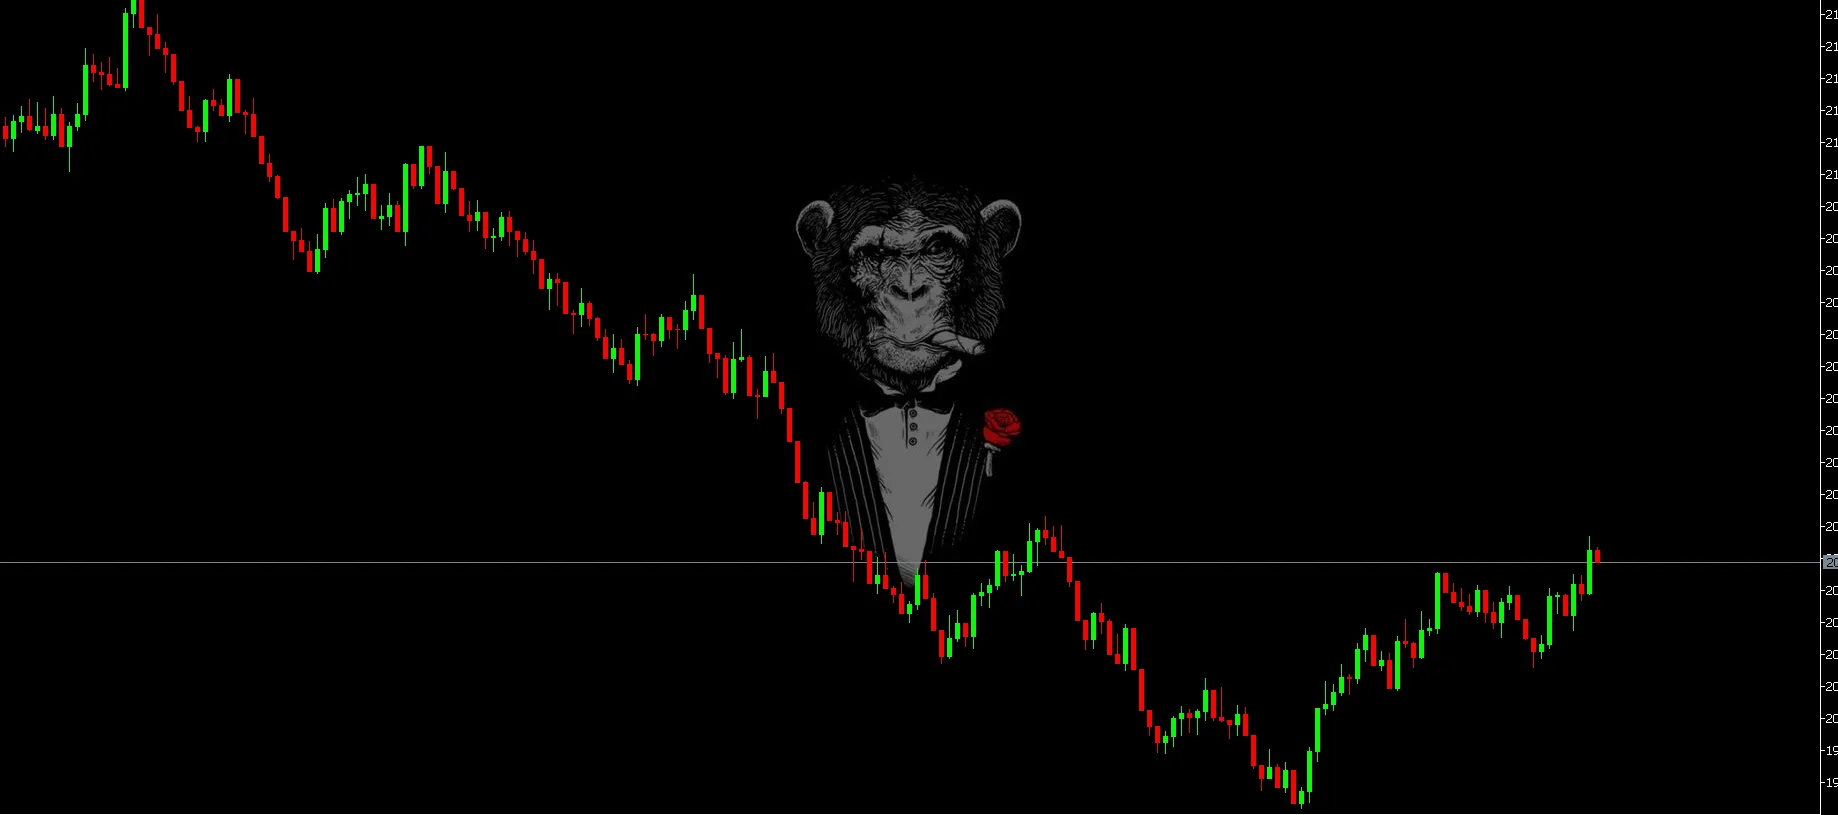
Hey traders! If you’re looking to spice up your MetaTrader 5 charts and make them more visually appe...
View Example Image If you're trading with MetaTrader 5 and looking for a way to personalize your cha...
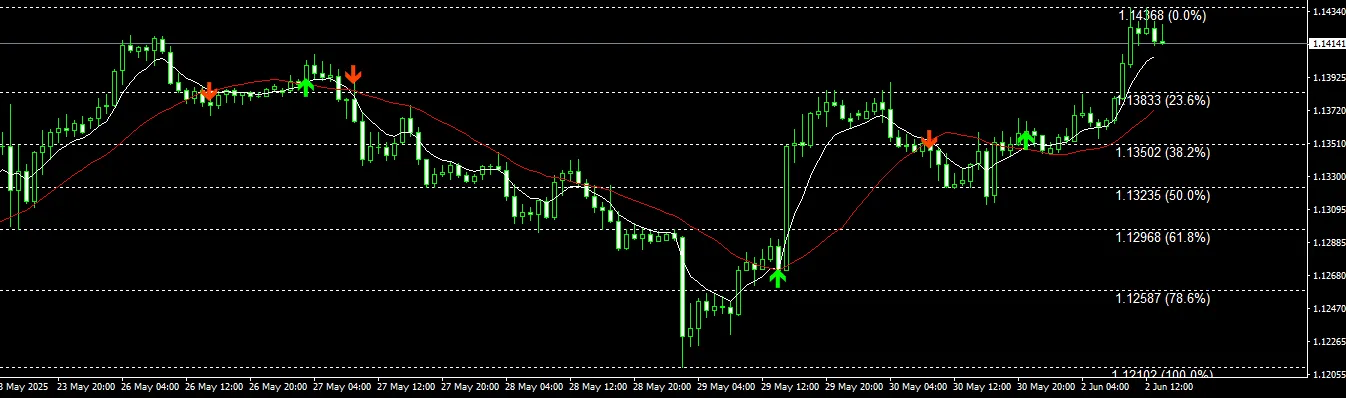
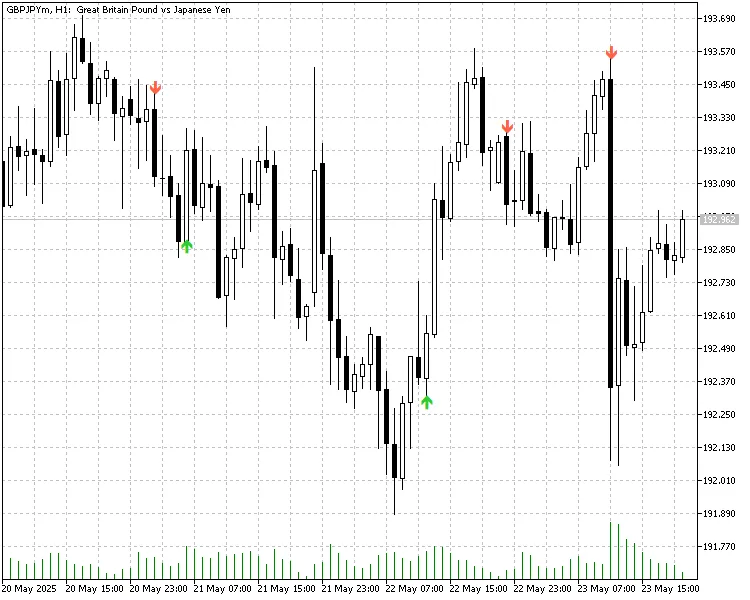
Description: If you're looking to enhance your trading strategy, understanding the bullish and beari...
Hey fellow traders! Today, let’s dive into a cool tool that can really amp up your trading game—the ...
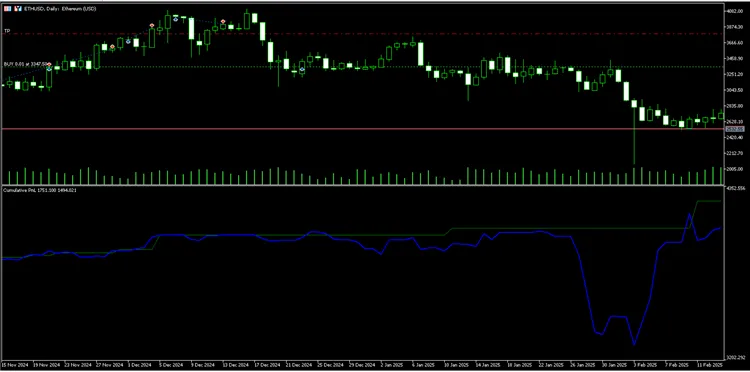
Cumulative P&L Indicator OVERVIEW The Cumulative P&L Indicator is a powerful tool that visual...
Main FeaturesCandle Filtering: The Candle Filter indicator is a game-changer for your trading strate...
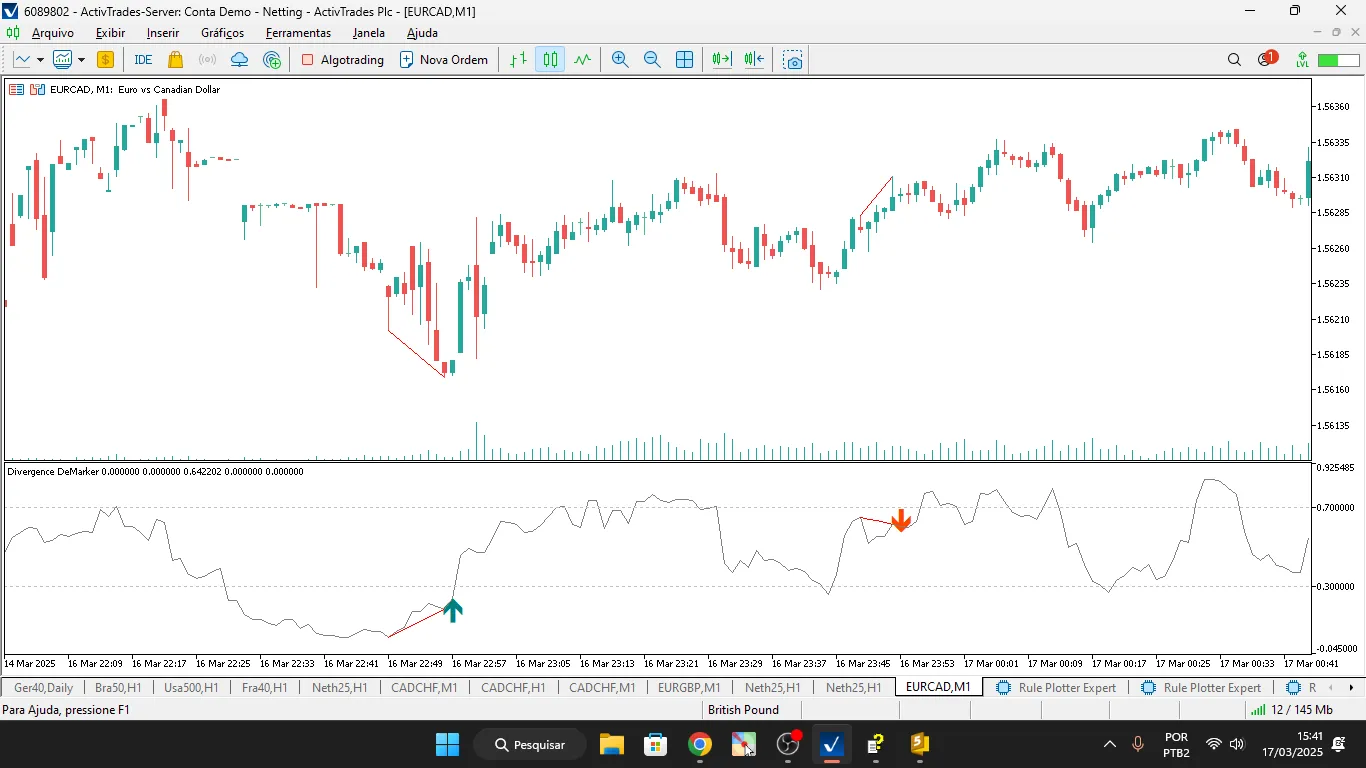
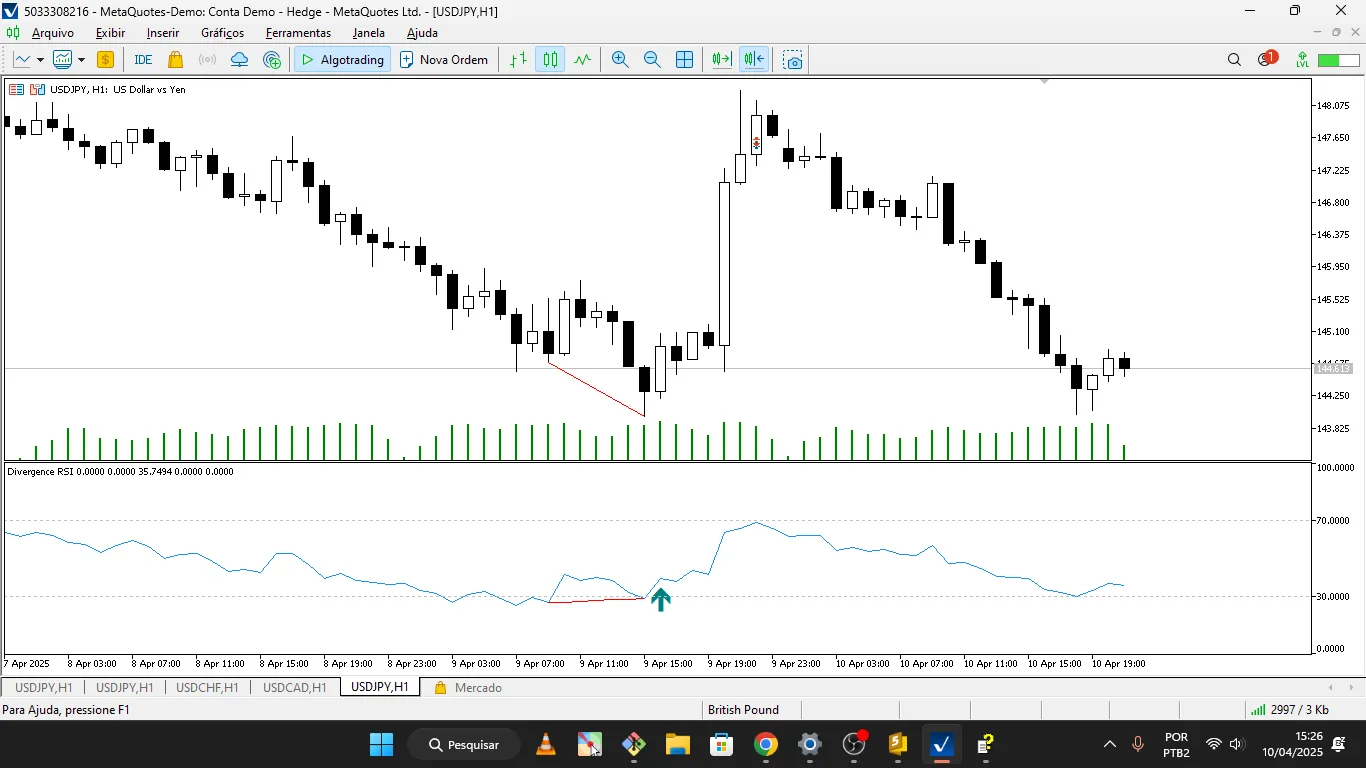
If you're diving into the world of trading, you might want to consider using the RSI Divergence indi...
What is the EquiPeak Drawdown Tracker? Visual Performance Reference: This handy tool lets you manua...
Features and FunctionalityThe DailyHighLow indicator is a handy tool that plots two essential lines ...
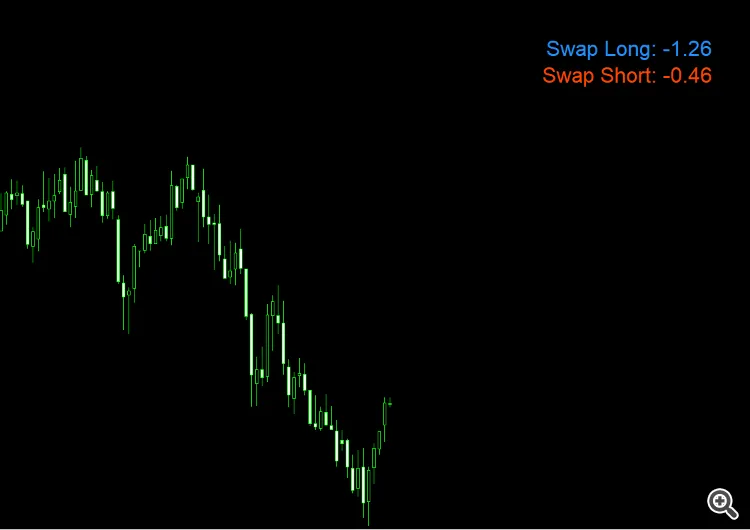
If you're looking for a straightforward way to keep tabs on the long and short swaps for a specific ...
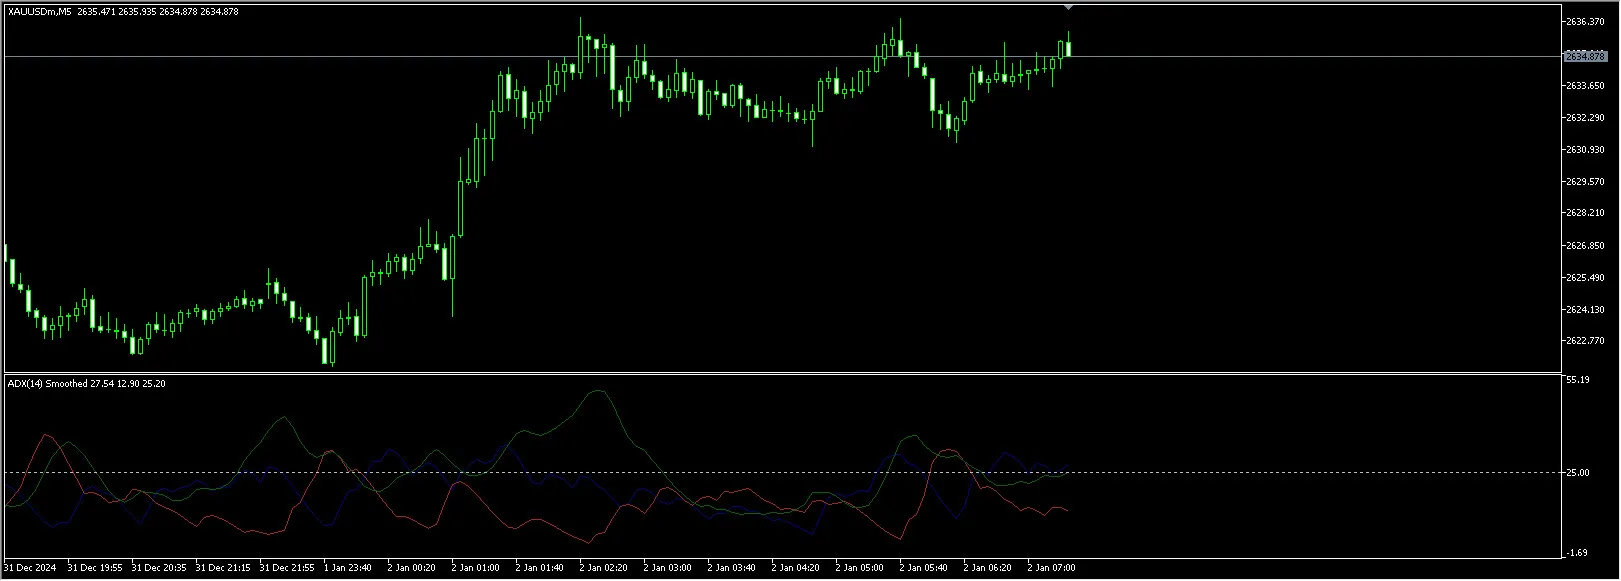
Hey fellow traders! If you're looking to boost your trading game, let’s dive into the ADX Smoothed i...
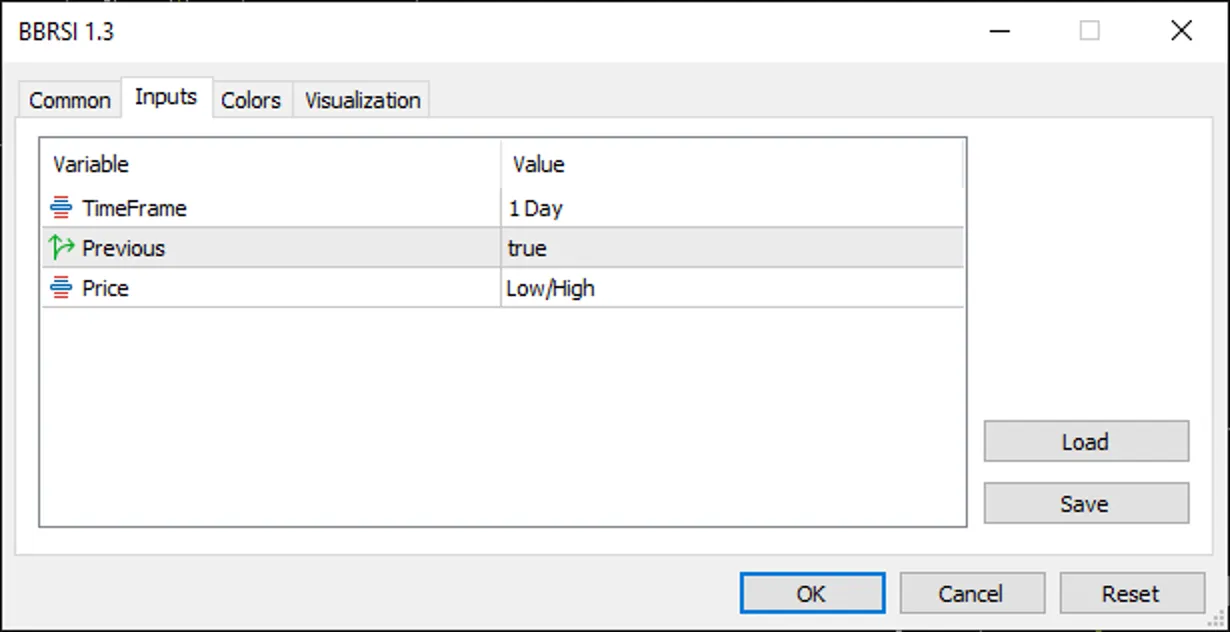
Introduction Hey fellow traders! If you’re looking to take your trading game up a notch, let me intr...
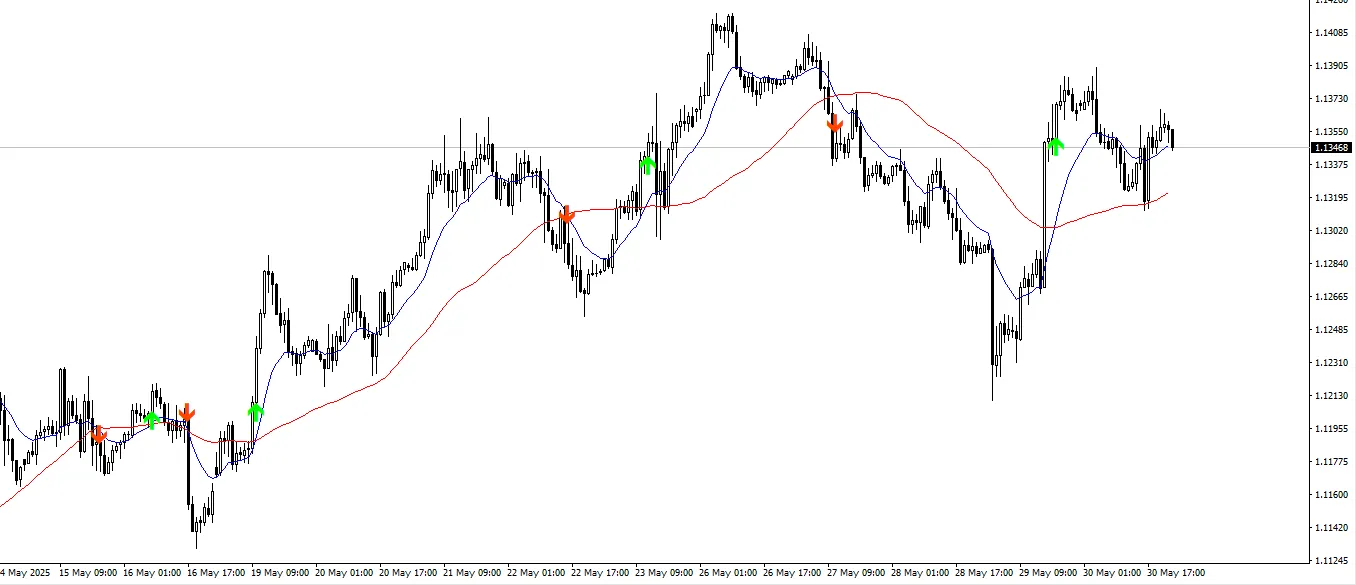
The BBMA, short for Bollinger Bands Moving Average, is a trading strategy that was pioneered by the ...
The BBMA, or Bollinger Bands Moving Average, is a dynamic trading strategy crafted by the well-known...
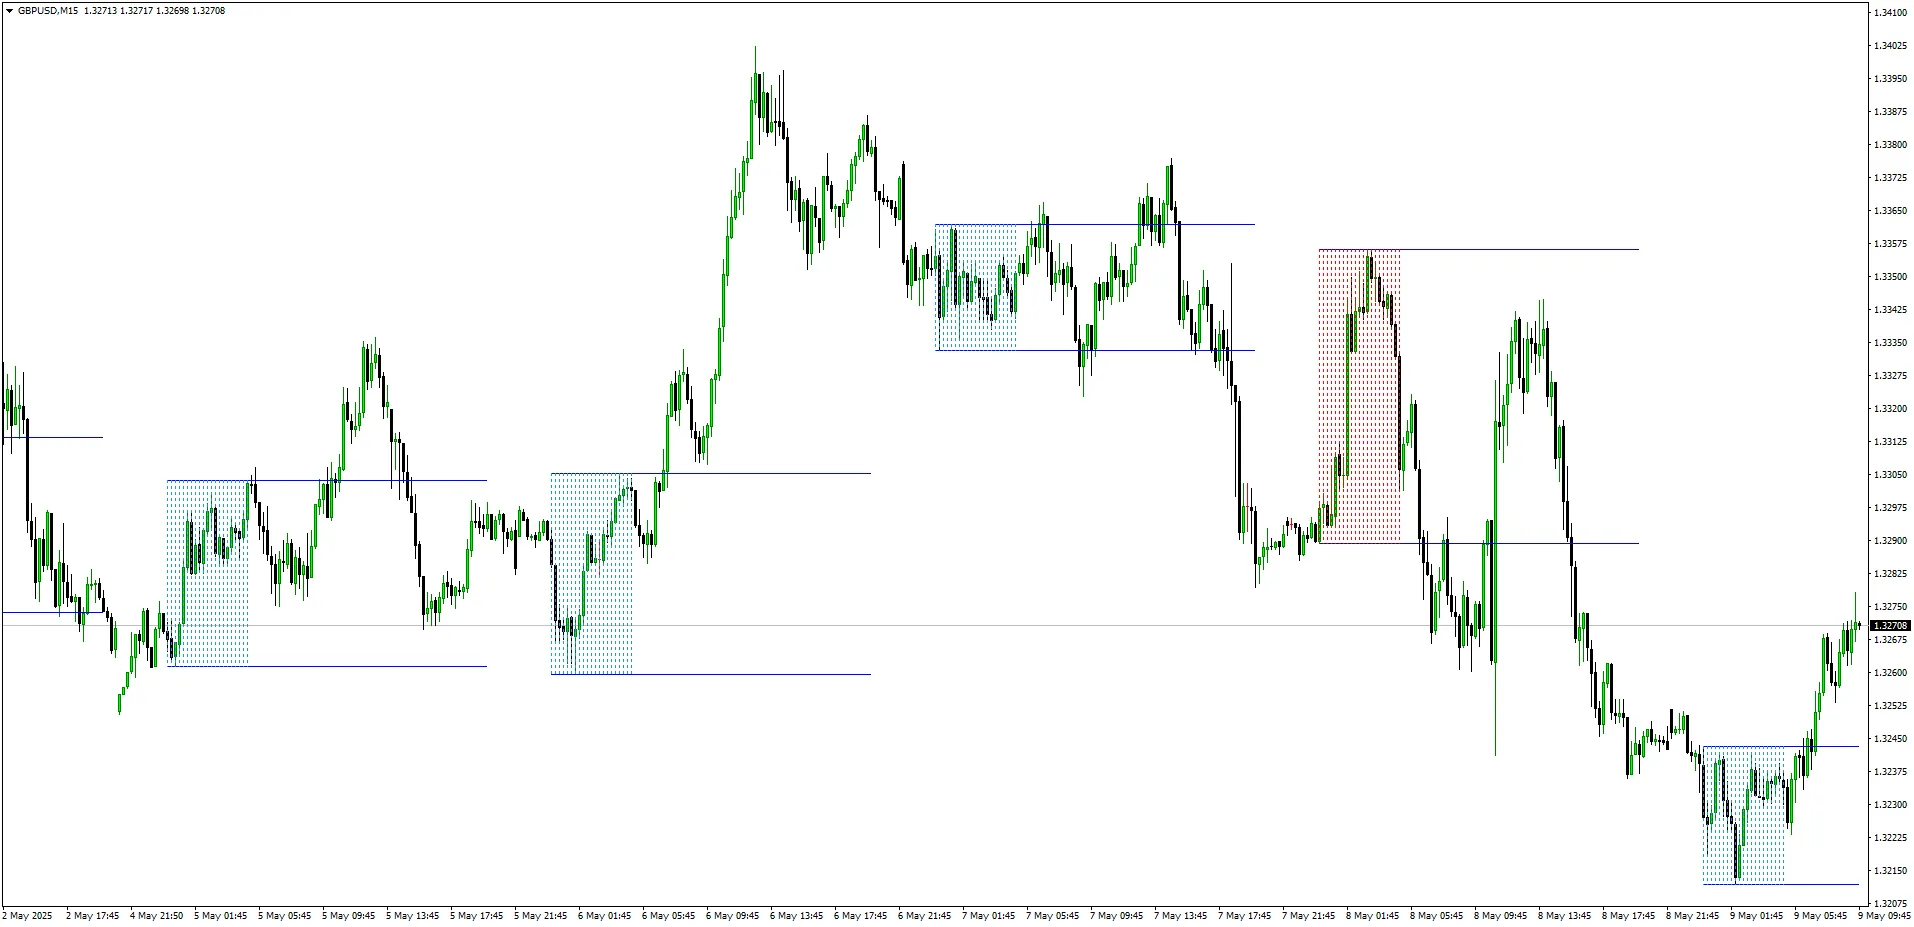
Hey fellow traders! Today, we're diving into the Range Breakout Indicator for MetaTrader 4. This han...