MetaTrader5
Unlocking Trading Signals with ZeroLag MACD for MetaTrader 5
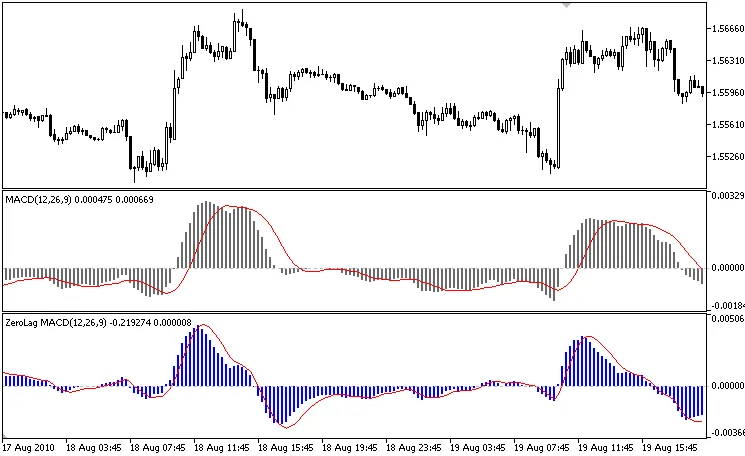
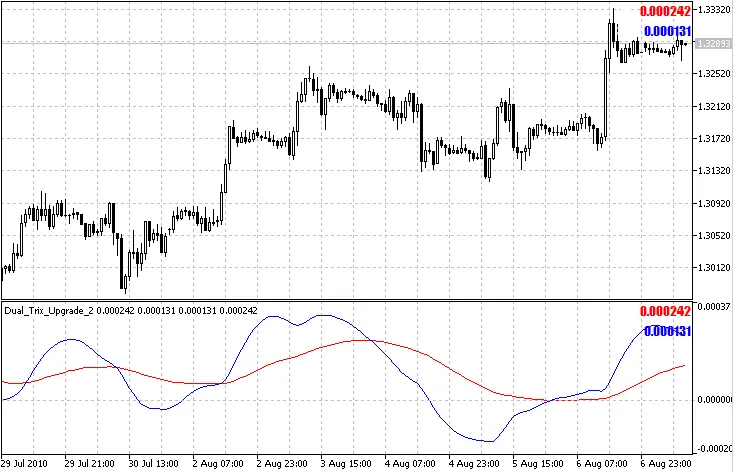
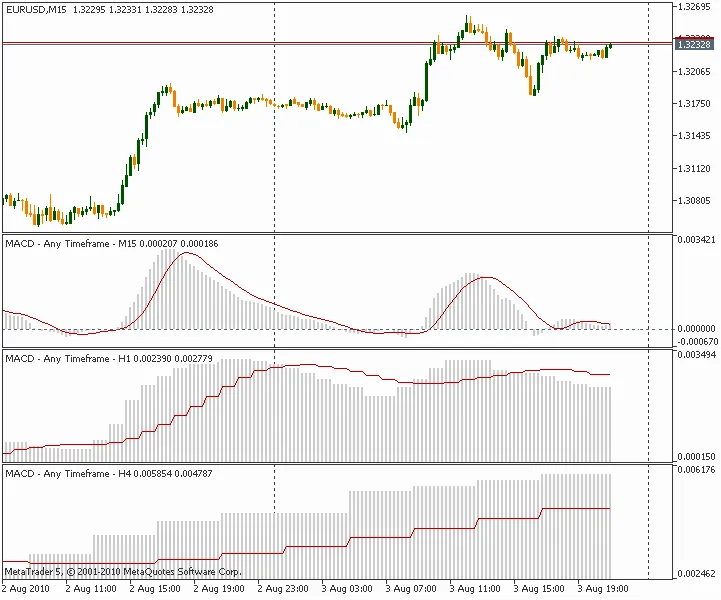
If you're looking to sharpen your trading strategy, the ZeroLag MACD for MetaTrader 5 might just be the tool you need. This oscillator is the MQL5 version of the ZeroLag MACD indicator, originally published in the Russian section of MQL4 CodeBase.
What sets this indicator apart is its ability to provide signals a few bars ahead compared to the standard MACD. Plus, its divergence signals are much clearer, giving you an edge in your trading decisions.
How is it Calculated?
ZeroLAG MACD(i) = (2*EMA(Close, FP, i) - EMA(EMA(Close, FP, i), FP, i)) - (2*EMA(Close, SP, i) - EMA(EMA(Close, SP, i), SP, i));
ZeroLAG MACD Signal(i) = 2*EMA( ZeroLAG MACD(i), SigP, i) - EMA(EMA( ZeroLAG MACD(i), SigP, i), SigP, i);
Where:
EMA - Exponential Moving Average;
Close - Close price of the bar;
FP - Period of fast moving average;
SP - Period of slow moving average;
SigP - Period of signal moving average.
2010.08.24