Technical Indicator

Understanding the RAVI Indicator: A Simple Guide for Traders
MetaTrader4
Understanding the RAVI Indicator: A Simple Guide for Traders

The RAVI indicator, or Rate of Average Variation Indicator, is a handy tool in your trading toolkit. It uses two moving averages, calculated as a percentage, to help identify market trends. Here’s the formula for the RAVI: RAVI = 100 * (SMA(7) - SMA(65)) / SMA(65) According to trading expert T. Chand, you should pay attention to certain information lines when using this indicator. These lines are typically set at plus/minus 0.3% or plus/minus 0.1%, depending on the market conditions. When the RAVI crosses the upper line, it suggests that a bullish trend is starting. Conversely, if it crosses the lower line, a bearish trend may be beginning. A trend is considered to be in play as long as the RAVI continues to rise; if it starts to fall, then a downtrend may be underway. If the RAVI approaches the zero line, it indicates that the trend may be ending and a channel phase could be starting. However, if the RAVI bounces back without crossing the information lines, it might signal that the trend has resumed. This indicator is quite straightforward and bears similarities to the Price Oscillator and MACD. What sets it apart is its focus on the convergence-divergence of the rate as a trend indicator, emphasizing divergence rather than just the crossing of moving averages. In this version of the RAVI, bullish trends are highlighted in green, while bearish trends are marked in red. Areas of uncertainty or no clear trend are shaded in grey. However, feel free to tweak the colors to suit your preferences! In summary, the RAVI indicator can be a valuable addition to your trading strategy, providing clear insights into market trends. So why not give it a shot?

2009.01.21
Mastering the MTrendLine Alert Indicator for Effective Trading
MetaTrader4
Mastering the MTrendLine Alert Indicator for Effective Trading

Hey fellow traders! Today, I’m excited to introduce you to the MTrendLine Alert Indicator. It’s a nifty tool that’s part of the MTrendLine v2.2 EA, which you can use either as a standalone indicator or in conjunction with the MTrendLine EA. This indicator is designed to simplify your trading experience by utilizing four trend lines. These lines not only show the distance between the price and the trend lines but also give you signals when the price moves a specified number of points. Pretty handy, right? The beauty of this indicator lies in its modular design. Each block operates independently, allowing you to integrate any block into another indicator or EA easily. You can tweak the numbers as needed, ensuring that they don’t interfere with one another. Once you dive into the differences, it becomes quite intuitive! How to Use the MTrendLine Alert Indicator If you set TrendLine_1 or any other trend line to True, the indicator will display them on your chart continuously. If it’s set to False, you’ll need to manually add the trend line to your chart. Just enter the properties of the trend line and rename it (e.g., from Trendline 3444567 to Trendline 1, 2, 3, or 4), and you’re good to go! Many traders find this method more familiar and user-friendly. I don’t claim to have invented this tool, but I’ve been looking for something like this for a long time, and I’m thrilled to share it with you. As we approach the holiday season, I want to wish all traders good luck and happy trading!

2009.01.20
Unlocking the Power of the Hodrick-Prescott Filter for Trading Predictions
MetaTrader4
Unlocking the Power of the Hodrick-Prescott Filter for Trading Predictions

Author: gpwr Hey traders! Today, we’re diving into the Hodrick-Prescott (HP) filter—a tool that can really sharpen your trading edge. The standout feature of this filter is that it doesn’t lag behind the market; it’s calculated by minimizing an objective function. Let’s break it down: Objective Function: F = Sum((y[i] - x[i])^2,i=0..n-1) + lambda*Sum((y[i+1]+y[i-1]-2*y[i])^2,i=1..n-2 Where: x[] - prices y[] - filter values 
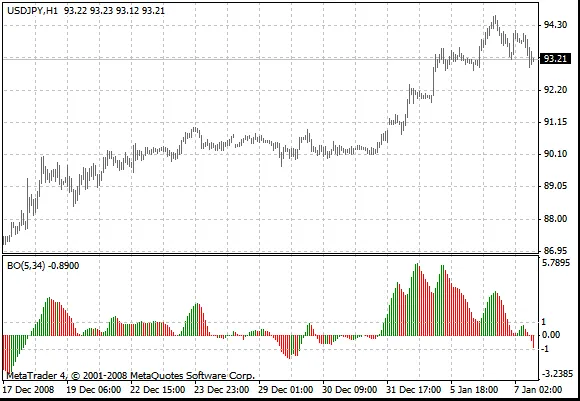
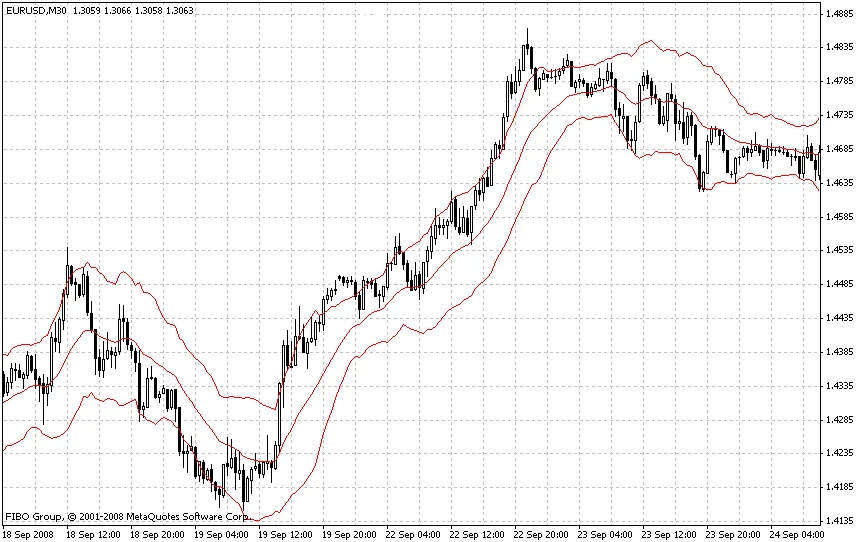
Check out the chart below to see how the filter performs (you can find the HP.mq4 file attached): So, if the HP filter can look ahead, what future values does it suggest? To find out, we need to create a low-frequency digital filter similar to the HP filter but based on past values from its own “twin filter.” Here’s how it breaks down: Low-Frequency Filter Equations: y[i] = Sum(a[k]*x[i-k],k=0..nx-1) - FIR filter or y[i] = Sum(a[k]*x[i-k],k=0..nx-1) + Sum(b[k]*y[i-k],k=1..ny) - IIR filter For the best results, choose a “twin filter” with a constant group delay (Tdel). IIR filters don’t fit the bill here. If you’re using FIR filters, the condition for frequency-independent delay is: a[i] = +/-a[nx-1-i], i = 0..nx-1 The simplest FIR filter that provides constant delay is the Simple Moving Average (SMA): y[i] = Sum(x[i-k],k=0..nx-1)/nx When nx is odd, Tdel = (nx-1)/2. By shifting the SMA filter values back by Tdel, you can align the SMA with the HP filter. However, keep in mind that the frequency parameters of these filters can differ significantly (check out the chart below): For the closest match between the filter values, make sure their channel widths are similar (for instance, -6dB). The HP filter’s channel width at -6dB is calculated like this: wc = 2*arcsin(0.5/lambda^0.25). For the SMA filter, you can find the -6dB channel width through numerical computation: |H(w)| = sin(nx*wc/2)/sin(wc/2)/nx = 0.5 
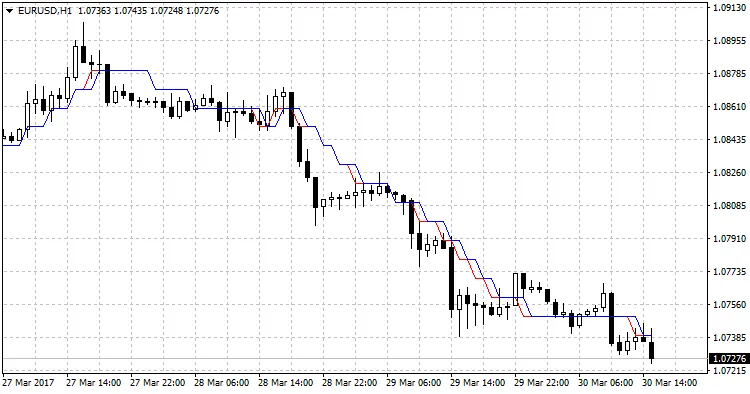
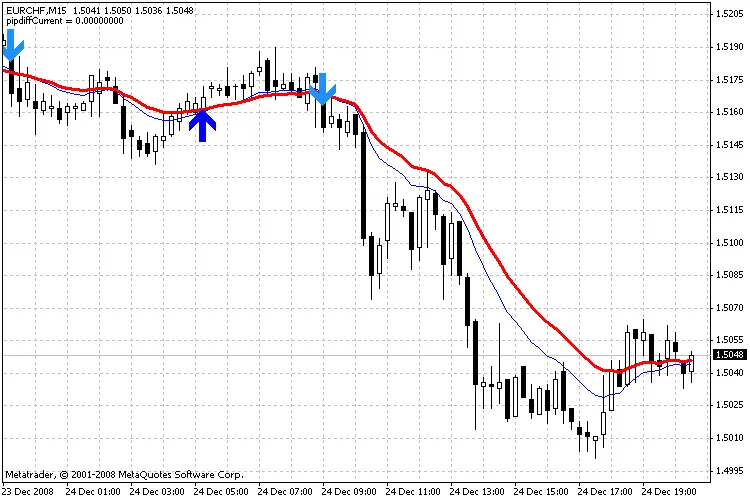
Take a look at the comparison of the two filters with similar channel widths below: the red line represents the HP filter (FiltPer = 25), and the blue line is the SMA (Period = 15, Shift = -7). Notice how the SMA doesn’t have data for the last 7 bars because it needs future prices to compute. Meanwhile, the HP filter (red) provides values. If the shifted SMA mirrors the HP filter on those last 7 bars after future prices come in, what could those values be? Prediction Algorithms: This indicator comes packed with two methods for making predictions: Method 1: Set the SMA length to 3 and shift it back by 1 bar. This length means the shifted SMA only lacks data for the last bar (Bar = 0) since it needs the next future price Close[-1]. Calculate the SMA filter’s channel width and set it equal to that of the HP filter. Find lambda. Determine the HP filter value at the last bar HP[0] and assume that SMA[0] (with unknown Close[-1]) gives the same value. Find Close[-1] = 3*HP[0] - Close[0] - Close[1] Increase the SMA length to 5. Repeat the calculations to find Close[-2] = 5*HP[0] - Close[-1] - Close[0] - Close[1] - Close[2]. Keep going until you’ve calculated the desired number of future prices (FutBars). Method 2: Set the SMA length to 2*FutBars+1 and shift it back by FutBars. Calculate the SMA filter’s channel width and set it equal to that of the HP filter. Find lambda. Calculate the HP filter values for the last FutBars and assume the SMA behaves similarly when new prices come in. Find Close[-1] = (2*FutBars+1)*HP[FutBars-1] - Sum(Close[i],i=0..2*FutBars-1), Close[-2] = (2*FutBars+1)*HP[FutBars-2] - Sum(Close[i],i=-1..2*FutBars-2), and so on. The indicator features the following inputs: Method - choose your prediction method LastBar - the number of the last bar to check predictions on existing prices (LastBar >= 0) PastBars - number of previous bars for the HP filter calculations (the more, the better, ideally PastBars > 2*FutBars) FutBars - number of predicted future values 
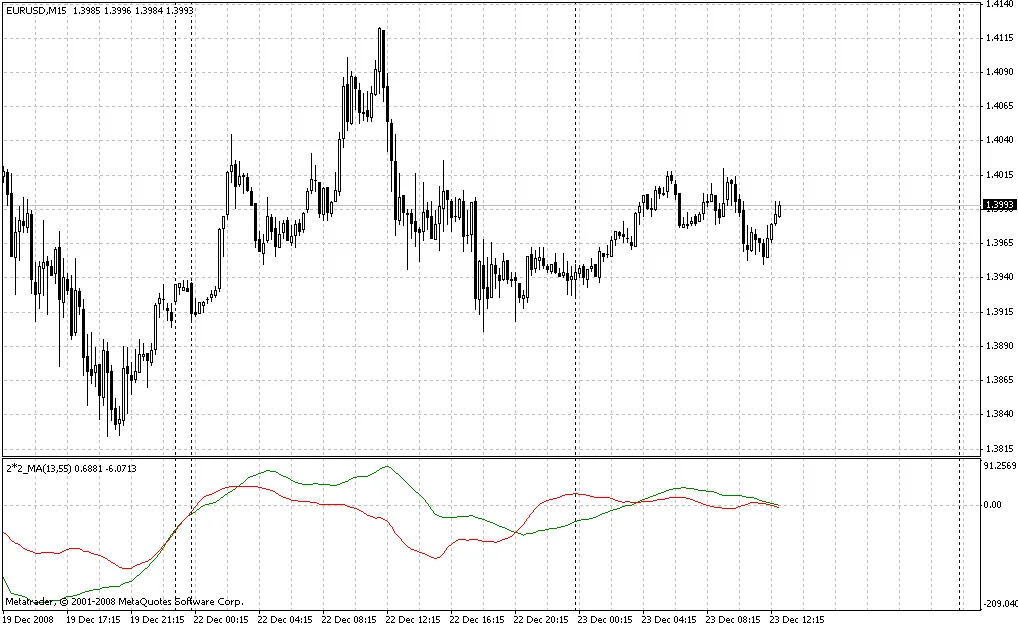
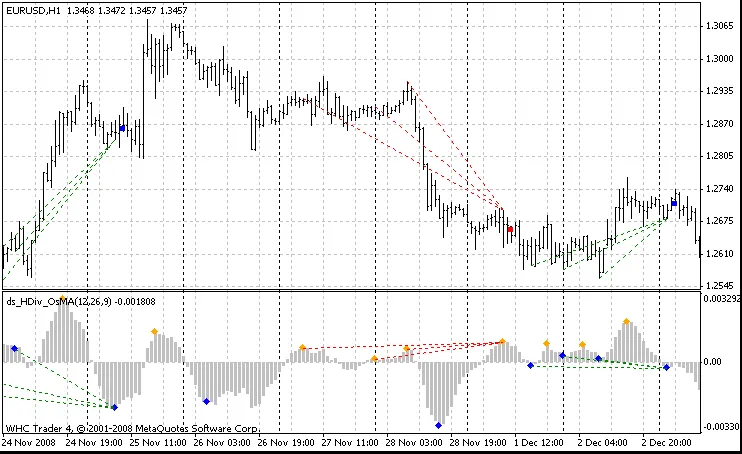
The indicator highlights predicted values in red. Check out the example of Method 1 below: 
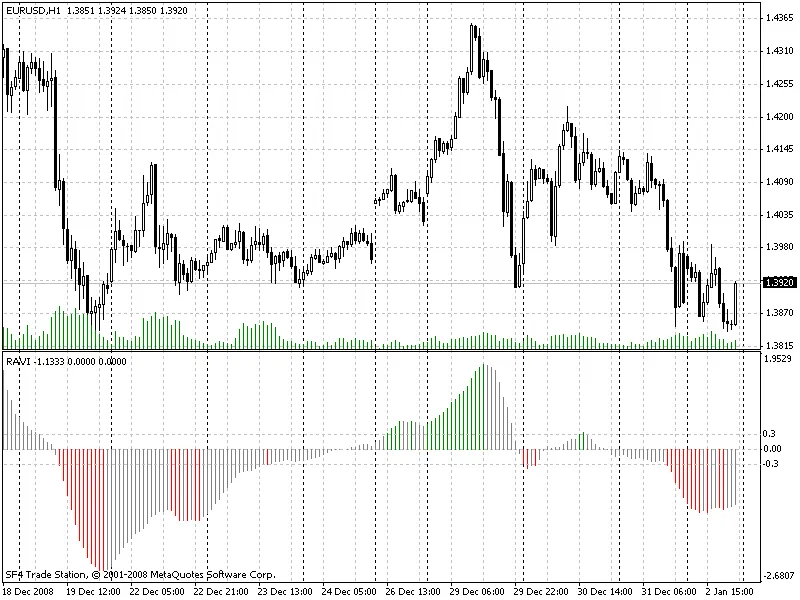
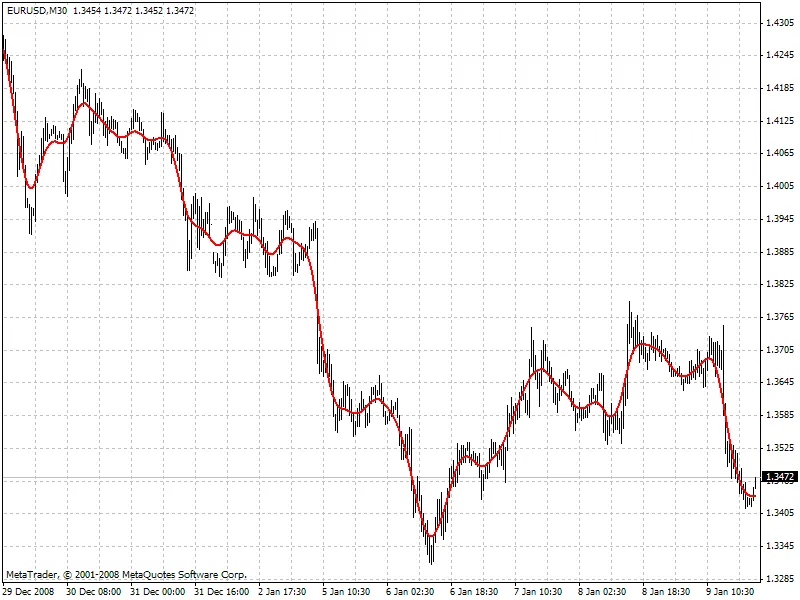
And here’s Method 2: While Method 2 tends to be more accurate, keep in mind that it can sometimes produce large spikes in the predicted first price. You can enhance this prediction method by exploring FIR filters with frequency parameters closer to those of the HP filter. Consider experimenting with Hanning, Blackman, Kaiser, and other filters with constant delay instead of just the SMA. Lastly, a big shoutout to user Korey for the original Hodrick-Prescott filter indicator shared in this forum thread.

2009.01.15
Maximize Your Trading Strategy with m-Fibonacci and m-Candles Indicators
MetaTrader4
Maximize Your Trading Strategy with m-Fibonacci and m-Candles Indicators

Hey fellow traders! Today, I want to share some insights on two fantastic indicators I've been using: m-Fibonacci and m-Candles. Personally, I prefer working on the M15 timeframe, as these indicators provide a clear view of H4 candlestick patterns and Fibonacci levels on the same chart. Plus, I've added a sound alert that chimes when the price nears one of those key levels—super handy! Here's a quick look at what my chart setup looks like with these indicators: Now, let’s dive into the settings for each indicator: m-Fibonacci Settings TFbar: This is the Fibonacci period, and you can use standard timeframes like 60, 240, or 1440 minutes in MT4. FileName: Choose the sound file that will play when the price approaches one of the Fibonacci levels. delta: This is the distance the current price needs to reach the Fibonacci level before the sound alert triggers. Notice: A simple flag to determine whether the sound file should actually play. m-Candles Settings TFBars: Set this to your preferred larger standard timeframe. NumberOfBars: This indicates how many bars from the larger timeframe you want to analyze. ColorUp: Choose the color for bullish candlesticks—this helps in quickly identifying upward trends. ColorDown: Select the color for bearish candlesticks to spot downward trends easily. I’d love to hear your thoughts on these indicators! You can reach out to me directly—my ICQ number is 138-092-006. Happy trading!

2009.01.09
Understanding the Keltner Channel: A Key Tool for Traders
MetaTrader4
Understanding the Keltner Channel: A Key Tool for Traders

What is the Keltner Channel? If you’re diving into technical analysis, the Keltner Channel is a valuable indicator you might want to add to your toolkit. This indicator helps traders identify potential price movements by creating dynamic support and resistance levels, much like the Bollinger Bands do. Setting Up the Keltner Channel The Keltner Channel is based on the Exponential Moving Average (EMA) and the Average True Range (ATR). Here’s a quick breakdown: Base Line: EMA with a period of 20. Channel Lines: +/- ATR (Average True Range). Multiplier: Set to 2.0. You can find the codebase for this indicator here, but keep in mind that it may not match the traditional setup we’re discussing. Why Use the Keltner Channel? The essence of the Keltner Channel is to provide floating lines of support and resistance that adjust with market volatility. By utilizing the EMA20 as your base, you can better capture the price action in different market conditions. When applying this indicator to your charts, remember to fine-tune the coefficients for the channel lines. These are fractional values and can vary based on the specific trading instrument you’re analyzing. Final Thoughts In summary, the Keltner Channel is a powerful tool for traders looking to enhance their technical analysis. By understanding its mechanics and adjusting the parameters to fit your trading style, you can gain a clearer insight into potential market movements. Happy trading!

2009.01.06
Understanding the Multy_MA Indicator: A Guide for Traders
MetaTrader4
Understanding the Multy_MA Indicator: A Guide for Traders

Hey there, fellow traders! Today, I want to dive into the Multy_MA indicator, which helps you visualize the difference between two moving averages (MAs) in a separate window. You can customize both minor and major moving averages according to your trading strategy. This indicator is designed for group moving, making it easier to track market trends. Now, here's a little heads-up: there’s a bit of a glitch in the code. The indicator may not draw everything immediately. To get it up and running smoothly, you might need to reload the timeframe. Make sure your history is uploaded. If the display seems off, try switching the timeframe again; this should refresh the data and redraw the picture correctly. As a handy tip, if you hover your mouse over any line, the name of the currency will pop up at the bottom—super useful for quick references! Input Parameters: extern int MA_Period      =5; extern int MA_Basis       =233; extern int MA_Shift       =0; extern int MA_Method      =1; //---- extern string symbol_1   ="EURUSD"; extern string symbol_2   ="GBPUSD"; extern string symbol_3   ="USDCHF"; extern string symbol_4   ="USDJPY"; extern string symbol_5   ="AUDUSD"; extern string symbol_6   ="USDCAD"; extern string symbol_7   ="medium"; //---- //---- extern bool revers=false; Multy_MA So there you have it! The Multy_MA indicator is a handy tool for any trader looking to analyze moving averages effectively. Give it a try and see how it fits into your trading approach!

2009.01.05
First Previous 350 351 352 353 354 355 356 357 358 359 360 Next Last