If you're on the hunt for a fresh perspective on market strength, the AbsoluteStrength indicator for MetaTrader 5 might just be your new best friend. This tool serves as a fantastic alternative to the popular RSI, Stochastic, and DMI, all of which measure the balance of buyers and sellers in the market. Unlike these traditional indicators that are based on percentages, AbsoluteStrength calculates strength in points, providing a more nuanced understanding of market dynamics and helping you sidestep the slippage issues that can arise during strong trends with Stochastic.
In this version of the indicator, you can set up Strength and Weakness levels using three distinct methods:
- OverBought/OverSold Levels: Similar to what you find in RSI and Stochastic, these levels can be adjusted using the StrengthLevel and WeaknessLevel parameters (for example, 70 and 30).
- Standard Deviation Channel: This method uses the LookBackPeriod and coefficients for the upper (UpperMultiplier) and lower (LowerMultiplier) bounds of the channel to create a channel based on standard deviations.
- High/Low Channel: Built on the principles of price channels, this is regulated by the LookBackPeriod, StrengthLevel, and WeaknessLevel parameters.
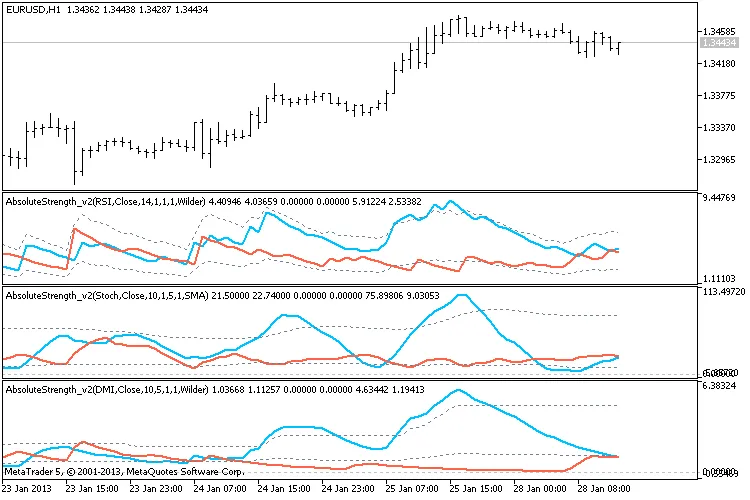
The image above illustrates the three methods for constructing Strength and Weakness Levels. The first sub-window shows the OverBought/OverSold levels, the second depicts the standard deviation channel, and the third highlights the High/Low Channel.
Additionally, this indicator offers two levels of smoothing, utilizing four types of Moving Averages (MA_Mode: SMA, EMA, Wilder, and LWMA):
- Preliminary Smoothing: This is done using the PreSmooth parameter to refine the price data.
- Main Smoothing: This focuses on the calculated Bulls and Bears using the Smooth parameter.
To identify the pivot points for the Bulls and Bears lines, the indicator employs signal lines that can be adjusted via the Signal and MA_Mode parameters. Plus, there's a built-in algorithm designed to draw lines for higher timeframes, ensuring you have the best tools at your disposal.
Related Posts
- Mastering the FE Fibonacci Expansion Indicator for MetaTrader 4
- Mastering the Fibonacci ZigZag Indicator for MetaTrader 5
- Unlocking the Power of Master Tools for MetaTrader 4
- Visualize Current Trends Across All Time Frames with This MetaTrader 4 Indicator
- Unlocking the Power of ColorJFatl_Digit_Alert: Your Go-To MT5 Indicator