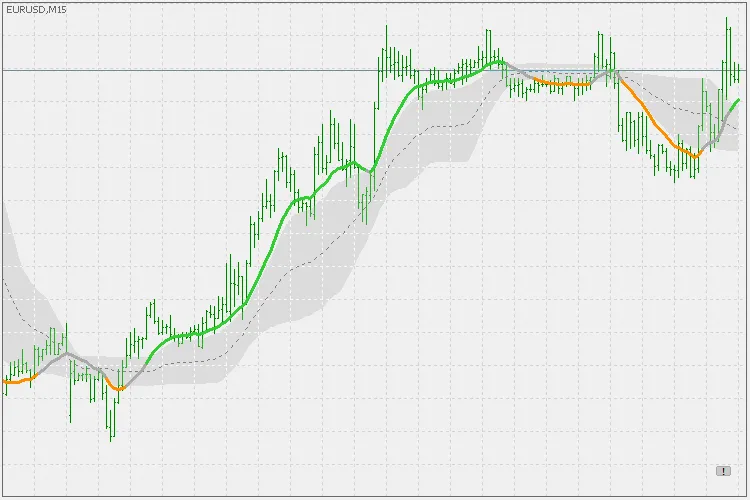
Let's dive into the PDFma indicator for MetaTrader 5, a nifty tool that traders are buzzing about. Essentially, it’s a type of weighted average, or as some prefer to call it, a digital filter. This indicator employs a probability density function to calculate coefficients and averages, giving you a clearer picture of market trends.
In probability theory, a probability density function (PDF) is a function that tells us how likely it is for a continuous random variable to take on a specific value. Even though the absolute chance of hitting any one particular value is zero (thanks to the infinite possibilities), the PDF helps us gauge how likely different values are relative to one another.
For more on this, check out the detailed explanation here: Probability Density Function.
The PDFma indicator comes equipped with various features to enhance your trading strategy:
- Level Types: Choose from three levels - floating, quantile, or none (switching to "on slope" mode).
When it comes to alerts and colors, you have options for:
- Crossing outer levels
- Crossing middle levels
- Change in slope
This indicator incorporates standard price data, Heiken Ashi prices, and supports multi-time frame analysis, which is a must-have for modern traders.
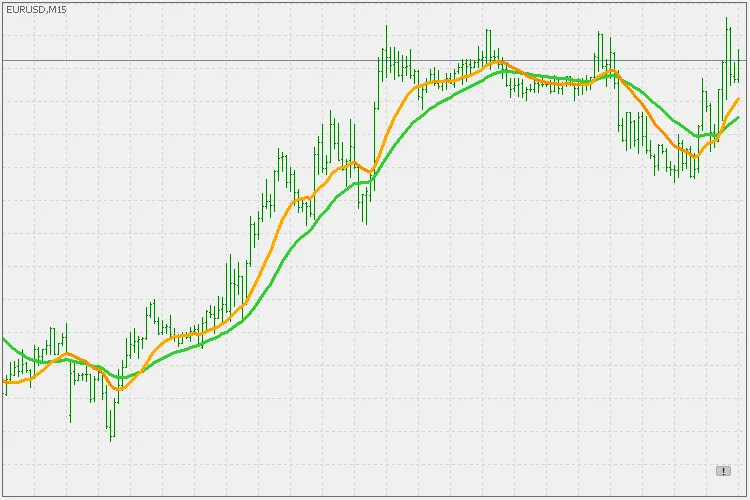
Now, let’s talk about some of the more intricate features: the variance and mean parameters.
Both of these settings tweak the "speed" of the PDFma. Variance can range from 0 to 1. A smaller variance results in a faster and less smooth PDFma. For instance, in the example below, the green line uses a variance of 1, while the orange line shows a variance of 0.5.
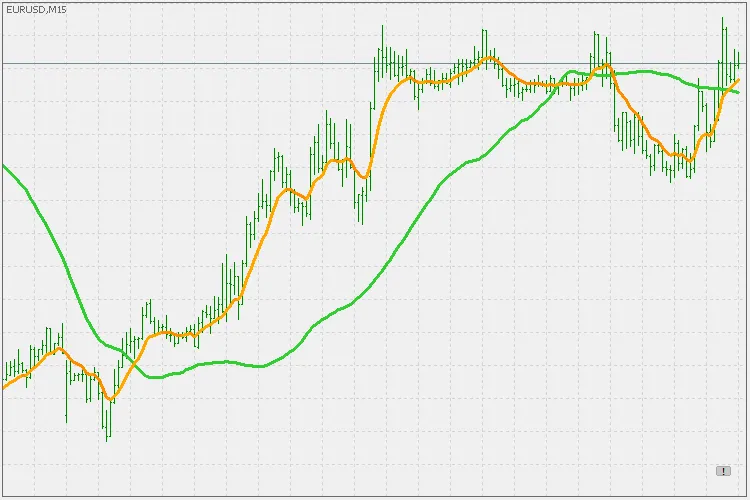
The mean parameter works similarly, ranging from -1 to 1. In the example shown, the green line uses a mean of 1, whereas the orange line uses a mean of -1.
There’s plenty of room for experimentation with this type of filter and average, so don’t hesitate to play around with the settings to find what works best for your trading style!