Color Fill – MA1 + MA2: Also Available for MT5
The Color Fill indicator, also known as the Color Histogram, is a powerful tool that enhances your visual perception of price action. It helps you make informed decisions on trade entries, continuations, exits, and re-entries during trend continuation.
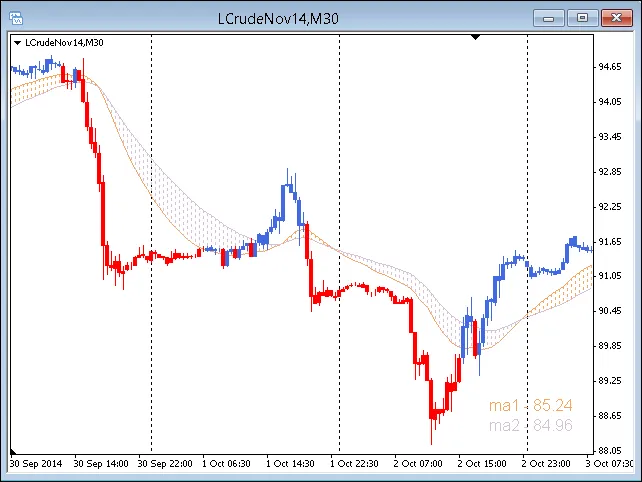
What This Indicator Draws
- Two Moving Averages: MA1 and MA2.
- Price Labels for MA1 and MA2.
- Multiple Color Fill options to visualize market conditions.
Color Fill Options
- Color Fill between the Price and MA1.
- Color Fill between the Price and MA2.
- Color Fill between MA1 & MA2.
- No Fill.
Visual Example: Color Fill - 3 of 1, 2, 3, or 4.
To check the chart, navigate to Chart Properties (press F8).
Parameters and Trading Insights
- All input parameters and options can be modified and will save automatically.
- Explore your personal preferences to get the most out of the tool.
- The default periods for MA1 and MA2 are set to 50 and 100 EMA, but feel free to adjust them as needed. Increasing the line thickness can help with visibility.
- For lower timeframes, consider enhancing your analysis with the Session Open V-Line Indicator.
- Using Color Fill – MA1 + MA2 as part of your Trading System is at your discretion and encourages innovation.
MA1 and MA2 Price Labels
- Labels are initially placed in the lower right corner, but you can reposition them anywhere on the chart.
- If you don’t need the Price Labels, you can easily hide them.
- Hiding MA1 or MA2 will also hide the corresponding Price Label.
To ensure the accuracy of Price Labels, draw a horizontal line on your chart and set its parameters to match the price indicated on the MA1 or MA2 Label. The line should align perfectly with the end of the MA line you choose.
Important Notes
Color Fill – MA1 + MA2 is built on the core code of the Custom Moving Average Indicator (Copyright © 2004, MetaQuotes Software Corp.).
While the original indicator code does not include a Price Inputs Variable with different options, we've added this functionality. You can now choose from Close, Open, High, Low, and Median for your Price Inputs Variable.
To check the accuracy of Price coding, overlay a standard MT4 Moving Average (Insert → Indicators → Trend → Moving Average) on your chart and compare it against MA1 and MA2. The following parameters table includes all 20 test combinations.
For example, set the Test Component to SMA → Close and MA1 to SMA → Close. Both moving averages should overlay perfectly for the duration of the MA line. Use the Home and End keys to navigate to the start and end of the MA line (just ensure Auto Scroll is off). Complete the table for MA1 and MA2 based on this check. The author's tests cover the period from March 2006 to July 2013.
Inputs and Parameters
- MA_Color_Fill_1_2_3_or_4 – 3.
- MA1_Period – 50.
- MA2_Period – 100.
- MA1_Shift – 0.
- MA2_Shift – 0.
- MA1_Method – Exponential.
- MA2_Method – Exponential.
- MA1_Price – Close.
- MA2_Price – Close.
- Show_MA1 – true.
- Show_MA2 – true.
- MA1_Label_Color – indicator_color1.
- MA2_Label_Color – indicator_color2.
- Label_Bold – true.
- Label_Size – 12.
- Label_Corner – 3.
- Label_Left_Right – 20.
- Label_Up_Down – 10.
- Show_Labels – false.