The Trix indicator is a powerful tool that many traders rely on to identify market trends and potential reversals. If you’re looking to sharpen your trading skills, understanding the Trix is a great place to start!
What is Trix?
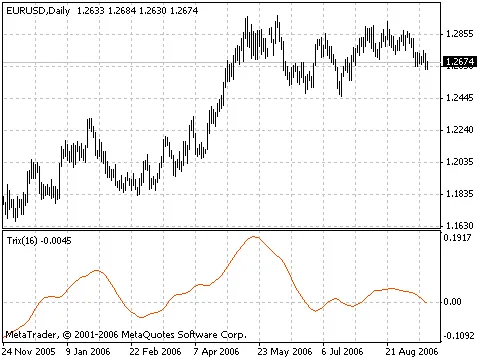
Trix, short for Triple Exponential Average, is a momentum indicator that helps traders spot trends by smoothing out price data. It’s particularly useful for filtering out market noise and making sense of price movements over time.
How to Use Trix in Your Trading Strategy
- Trend Confirmation: When the Trix line is above zero, it indicates an uptrend. Conversely, a Trix line below zero suggests a downtrend.
- Crossovers: Watch for crossovers between the Trix line and its signal line. A crossover above the signal line may signal a buying opportunity, while a crossover below can indicate a sell signal.
- Divergence: Look for divergences between the Trix and the price action. If the price is making new highs but the Trix isn’t, it could be a sign that the trend is weakening.
For a deeper dive into the technical aspects of the Trix indicator, check out this link.


Comments 0