Understanding the Relative Strength Index (RSI)
The Relative Strength Index (RSI) is a favorite among traders for analyzing market trends. One popular method is to spot divergences: when a security reaches a new high, yet the RSI fails to break its previous peak.
This divergence often signals an upcoming reversal. If the RSI then dips below its most recent trough, this marks the completion of a "failure swing," which traders often see as a confirmation of a potential reversal.
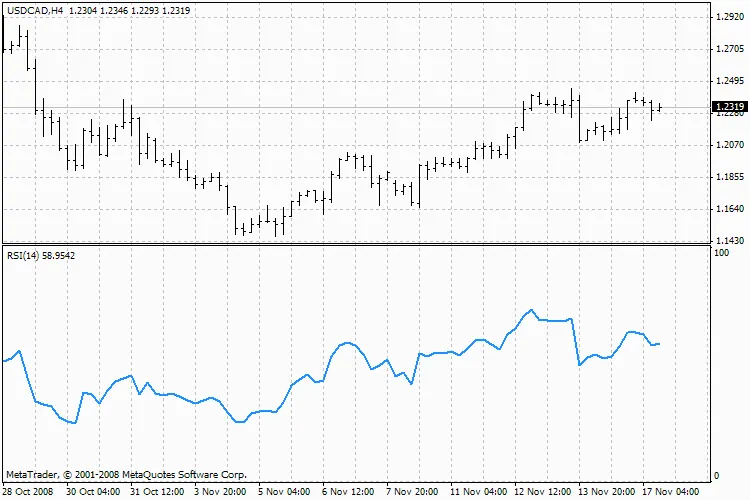
Relative Strength Index
Key RSI Signals for Chart Analysis
When using the RSI for chart analysis, keep an eye on the following signals:
- Tops and Bottoms: The RSI typically peaks above 70 and bottoms below 30, often before the price chart itself shows these levels.
- Chart Formations: You'll find that the RSI can form patterns like head and shoulders or triangles, which might not be apparent on the price chart.
- Failure Swing (Support or Resistance Breakout): This occurs when the RSI surpasses a previous peak or drops below a recent trough.
- Support and Resistance Levels: The RSI often highlights support and resistance levels more clearly than the price action itself.
- Divergences: As we mentioned earlier, divergences happen when the price hits a new high (or low) that isn’t confirmed by the RSI. Typically, prices will correct and align with the RSI direction.
RSI Calculation
The formula for calculating the RSI is straightforward:
RSI = 100 - (100 / (1 + U / D))
Where:
U = average number of positive price changes;
D = average number of negative price changes.
Learn More About the RSI
For a more in-depth look at the Relative Strength Index, check out the Technical Analysis: Relative Strength Index section on MetaTrader 5.


Comments 0