Hey there, fellow traders! If you're looking for a straightforward way to visualize market trends, let me introduce you to the Easy Trend Visualizer. This handy tool does exactly what it promises: it highlights where trends begin and end, giving you a clearer picture of the market's movement.
Built on the foundation of the standard Average Directional Movement Index (ADX), the Easy Trend Visualizer operates quickly and efficiently, displaying right in the main chart window of MetaTrader 4.
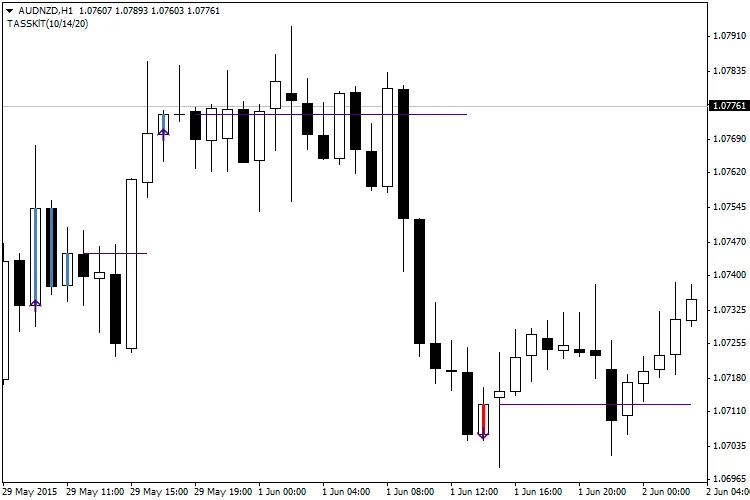
Input Parameters:
- ADXperiod1 (default = 10) — This sets the period for the first ADX indicator.
- ADXperiod2 (default = 14) — This determines the period for the second ADX indicator.
- ADXperiod3 (default = 20) — This configures the period for the third ADX indicator.
- UseAlert (default = false) — If set to true, this will generate alerts when a horizontal line starts plotting.
Recommendations:
- One thing to keep in mind is that this indicator redraws on the current bar. So, it's not ideal for entering positions right at that moment. However, previous bars remain intact and can serve as reliable signals for your entries. While the Easy Trend Visualizer is pretty accurate, it can throw out a few false signals. To mitigate potential losses, consider using moderate stop-loss levels. And remember, it's crucial to exit your position right after the trend fizzles out.
Related Posts
- Unlocking MetaCOT 2: Your Ultimate CFTC Indicator Toolkit for MT4
- Unlocking the Power of Master Tools for MetaTrader 4
- How to Use the Change Chart Symbol Menu for MetaTrader 4
- Unlock Trading Insights with Volume Profile + Range v6.0 for MetaTrader 5
- Visualize Current Trends Across All Time Frames with This MetaTrader 4 Indicator