Ever wanted to visualize your trading performance directly on your charts? Let’s dive into how to apply the Equity graph indicator in MetaTrader 4, so you can see your profit and loss right alongside your trading instruments.

The data we’re working with is stored in a file named equity.csv. This file holds the details we need to plot our equity graph.
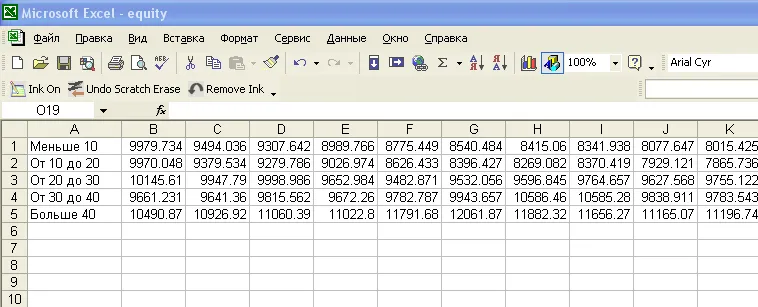
Now, here’s the fun part: we want to display this data right on the price chart of a currency pair—not in a separate window but integrated with the instrument's price action. This example indicator shows five average equity charts corresponding to different Money Compounding settings.
Step-by-Step Guide to Implementing the Indicator
- Compile the Indicator: Start by compiling the indicator and attaching it to your daily chart. Make sure the equity.csv file is placed in the experts\files\.. directory.
- Adjust the Code: Initially, you might not see anything on your chart, which is completely normal. This happens because the scale of the chart and the values from the file differ significantly.
- Modify the Code: To fix this, comment out one line in the indicator code and uncomment another line. Then, hit F5 to compile again.
- Check Your Chart: Now you should see a clear representation of your equity graph integrated with the price chart.

By making this adjustment, you essentially “tricked” the terminal into scaling the indicator to fit your current price range, allowing you to visualize your equity performance clearly.

Now, you’re all set! With the equity graph displayed alongside your trading instruments, you can better assess your performance and make more informed trading decisions. Happy trading!
Related Posts
- Hourly Buffers for Data Collection in MetaTrader 5: A Simple Guide
- Unlocking the Power of Master Tools for MetaTrader 4
- Enhance Your MetaTrader 4 Experience with Account Info Indicators
- Mastering the Fibonacci ZigZag Indicator for MetaTrader 5
- Unlocking the Power of the Hodrick-Prescott Filter for Trading Predictions