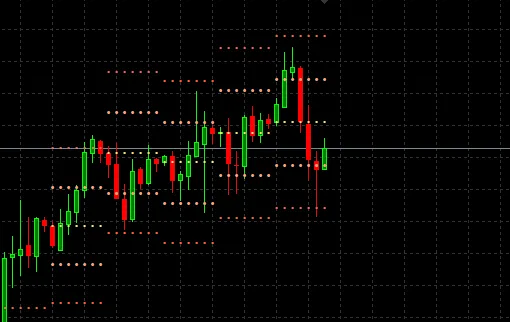
Hey fellow traders! Today, let’s dive into the Average Range Indicator for MetaTrader 5 and see how ...
Unlock Your Trading Potential with the Profit Maximiser If you're looking to boost your trading resu...
Hey there, fellow traders! Today, let’s dive into a unique indicator that's been making waves in the...
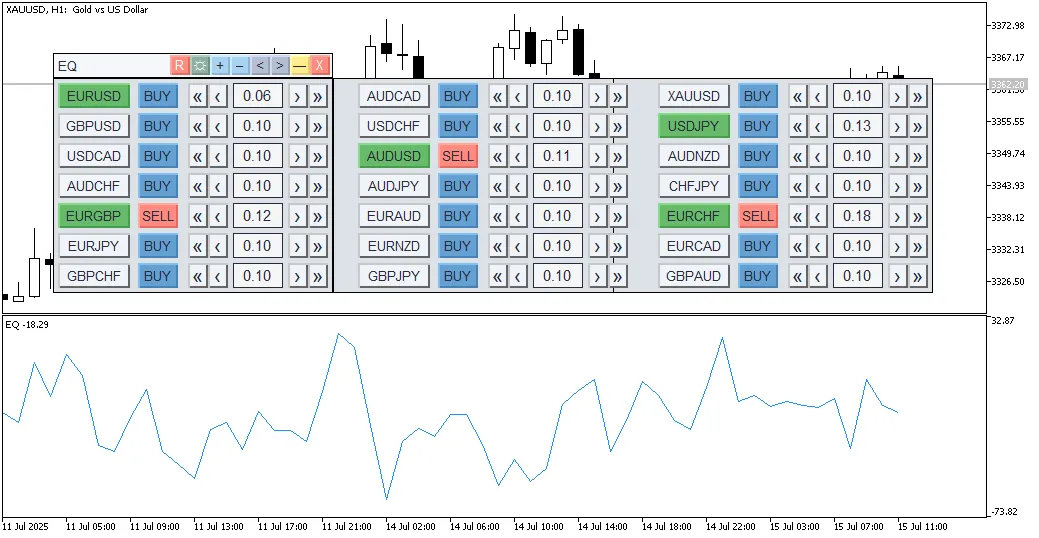
If you’re looking to level up your trading game, the EQ Dashboard indicator for MetaTrader 5 is here...
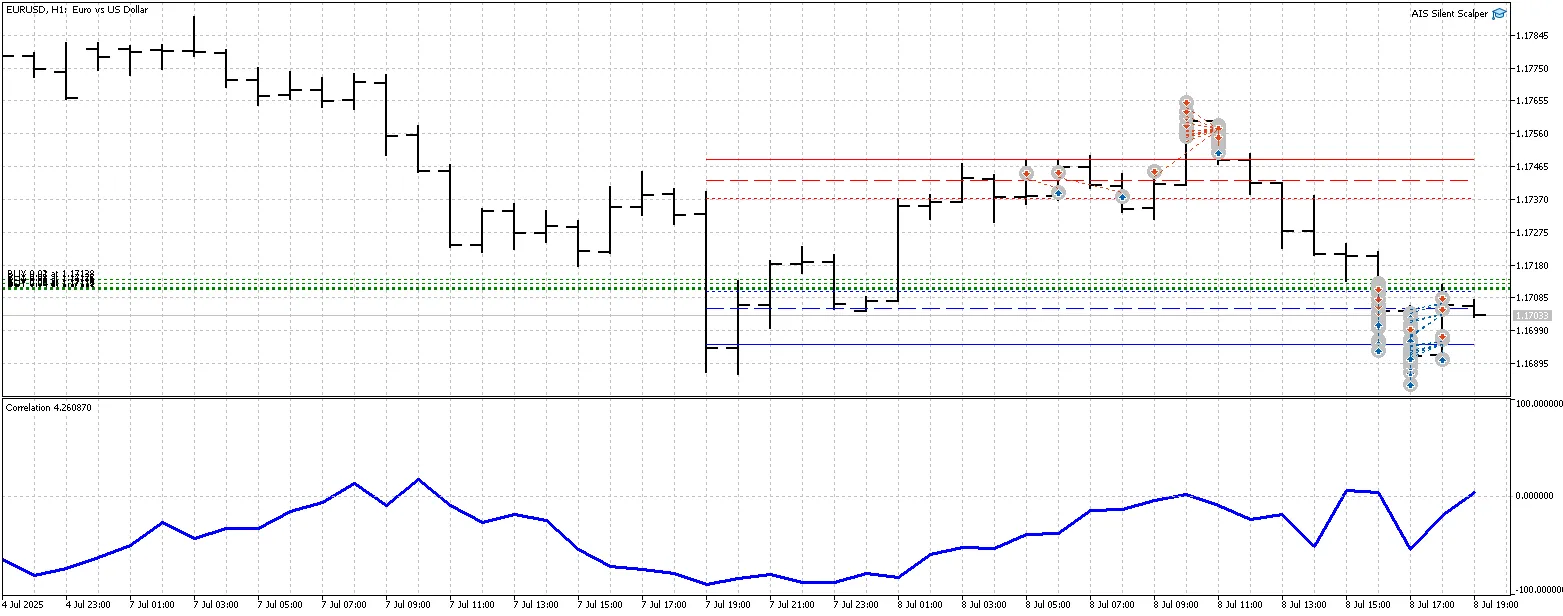
Hey fellow traders! If you're diving into the world of forex trading, understanding currency pair co...
Overview If you're looking to sharpen your trading strategies, you might want to check out this cu...
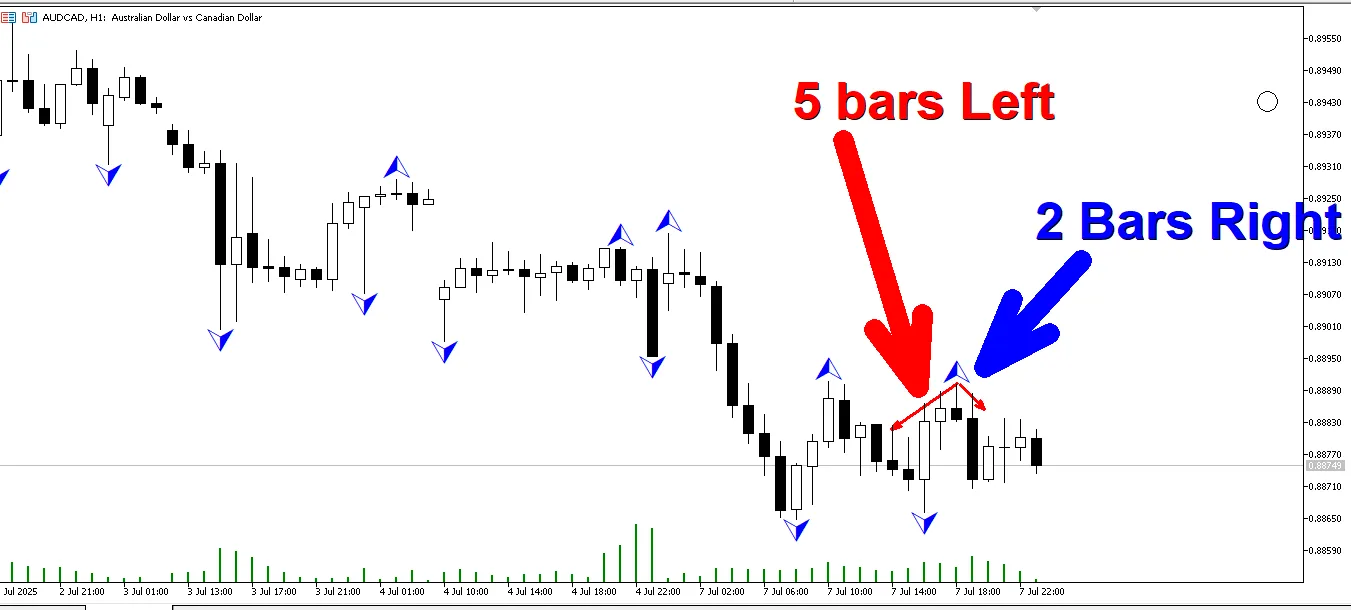
If you're looking to refine your trading strategy, the Custom Fractals indicator for MetaTrader 5 is...
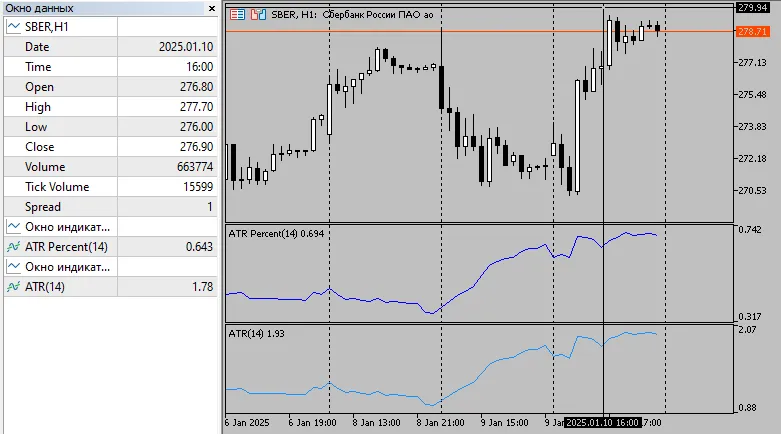
If you're diving into trading, you might have come across the ATR Percent indicator in MetaTrader 5....
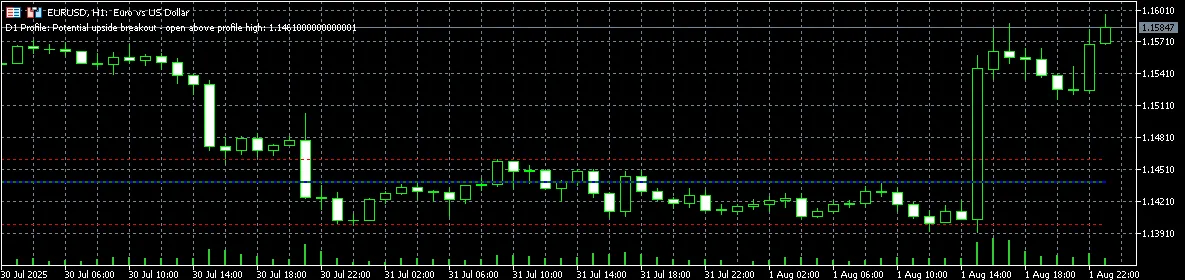
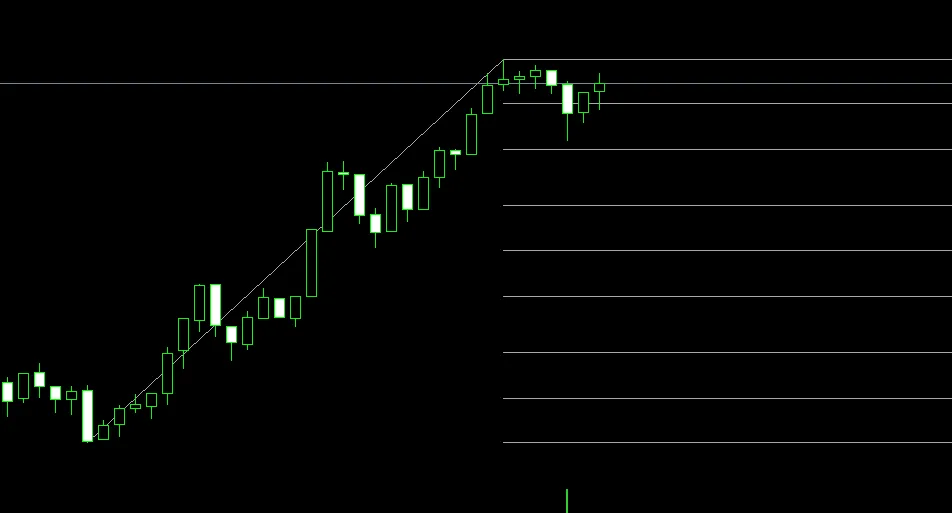
If you're diving into the world of trading, you might want to check out the Value Area Retracement...
Key Features Automatic Wave Detection: This nifty tool automatically spots major price swings and ...
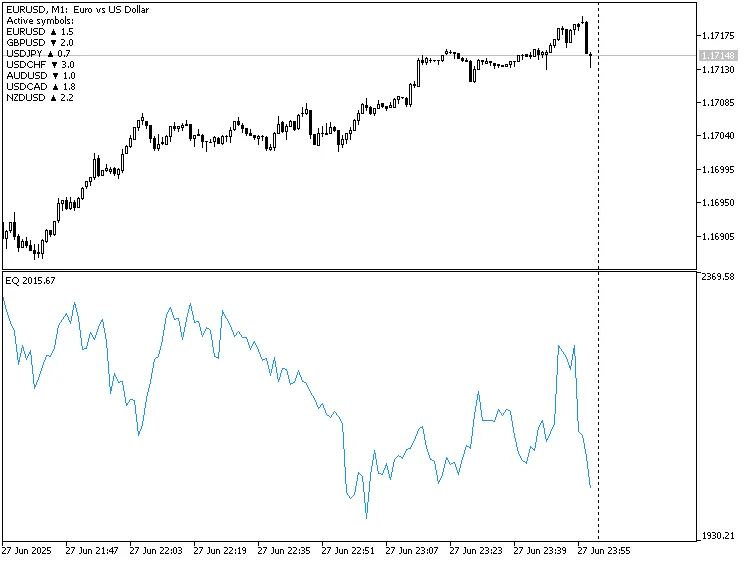
As traders, we all know that understanding our performance is key to success. The EQ indicator ...
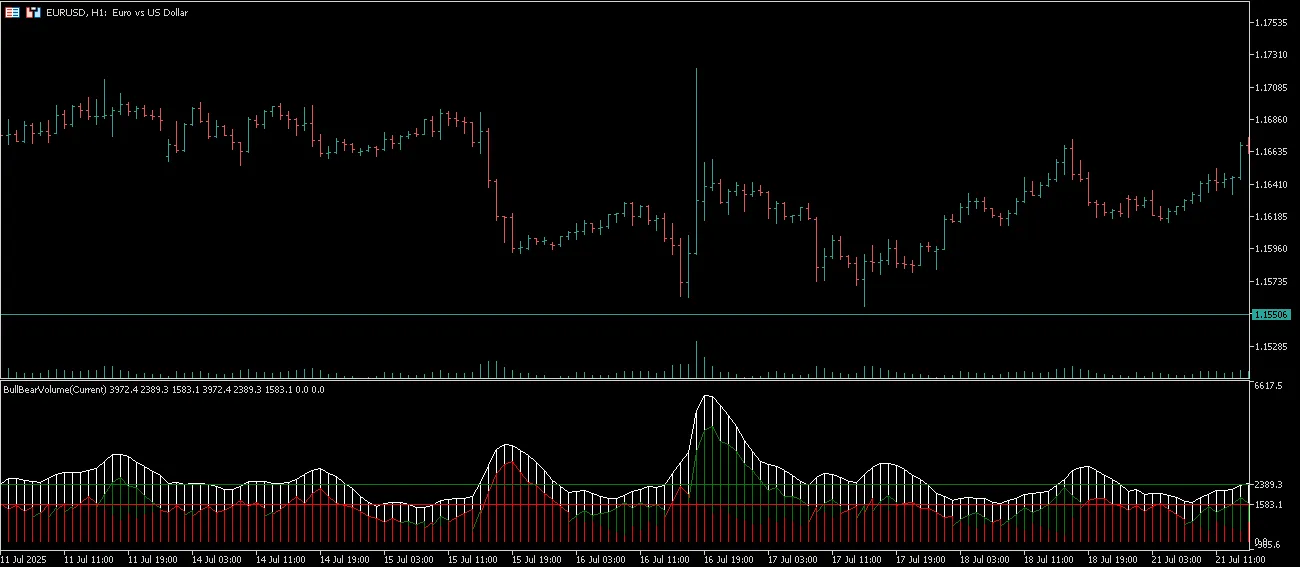
The Bull Bear Volume indicator is a powerful tool that helps traders dissect market volume into buye...
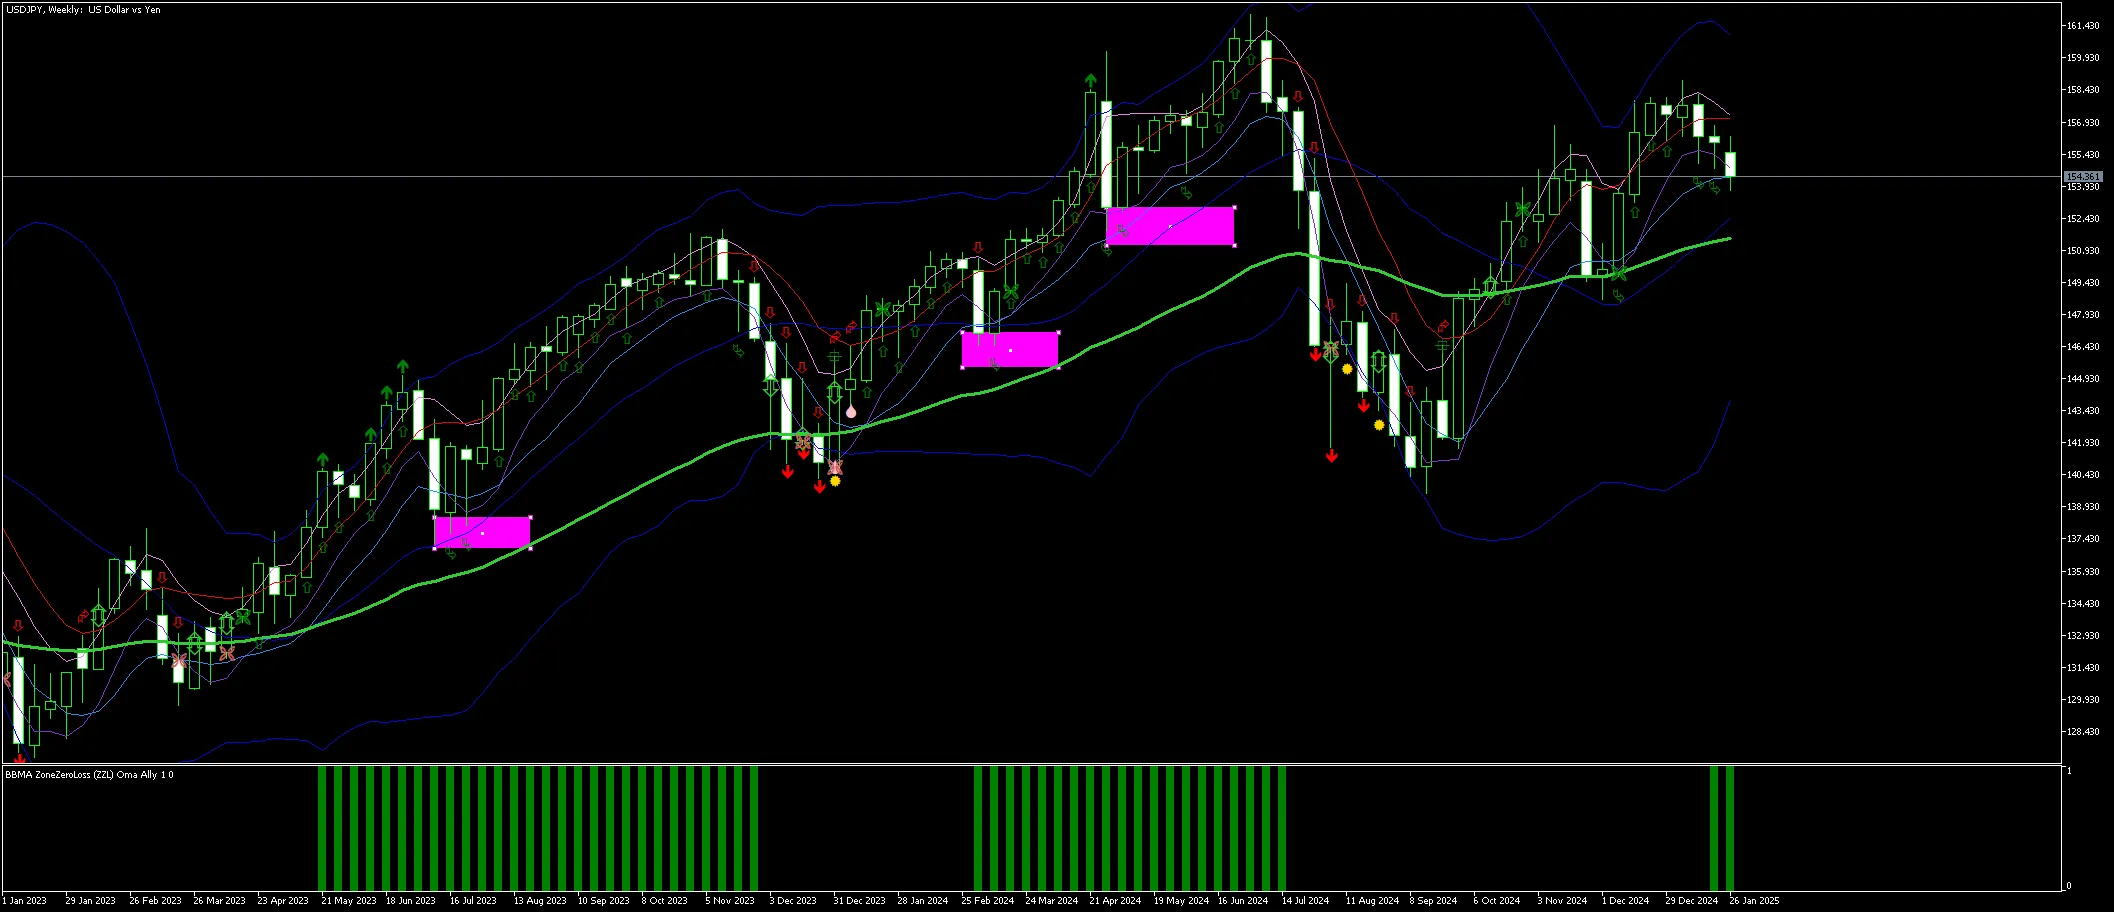
Introducing Oma Ally and the BBMA Strategy Meet Oma Ally, a savvy trader from Malaysia who crafted t...
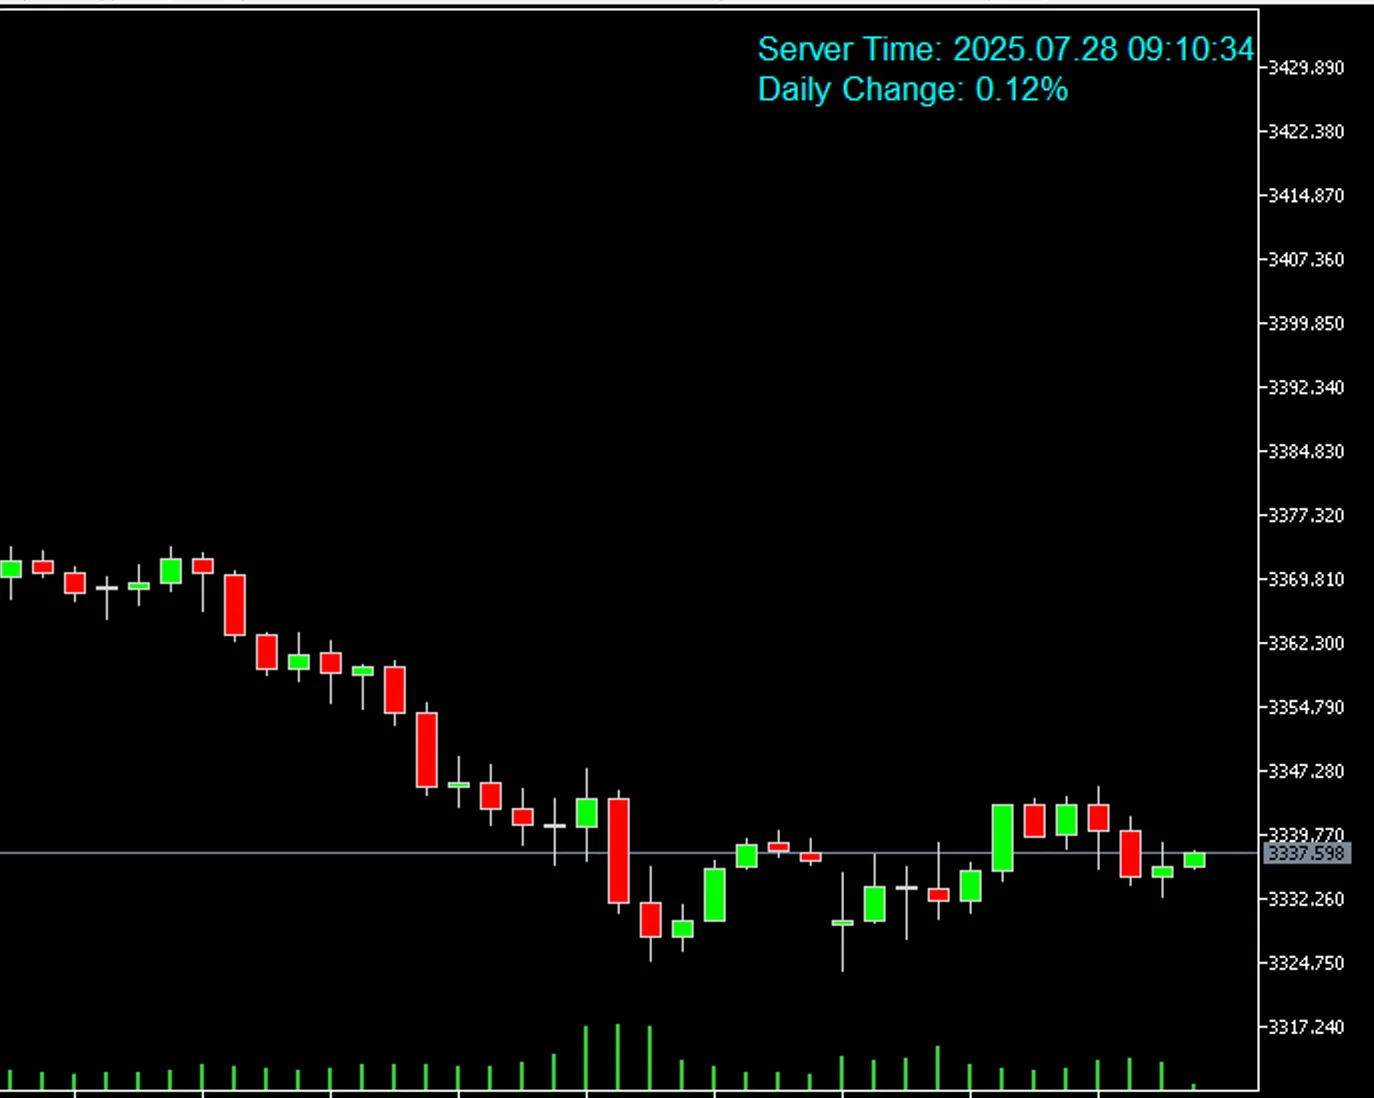
Key Features: Displays server time (not your local time) for precise market monitoring. Offers cu...
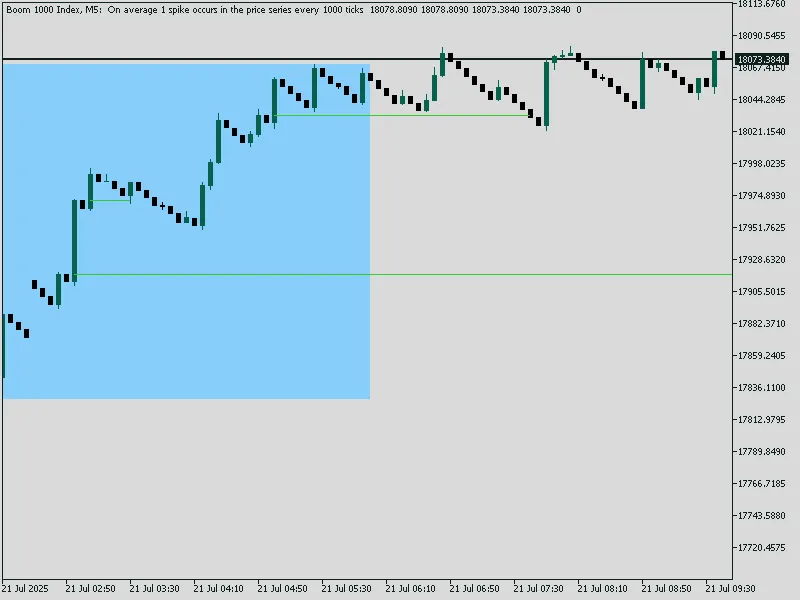
Hey there, fellow traders! If you're diving into the Boom Index arena, you’ll want to get the hang o...
Welcome to the world of trading! Today, we're diving into a powerful MT5 indicator that helps you sp...
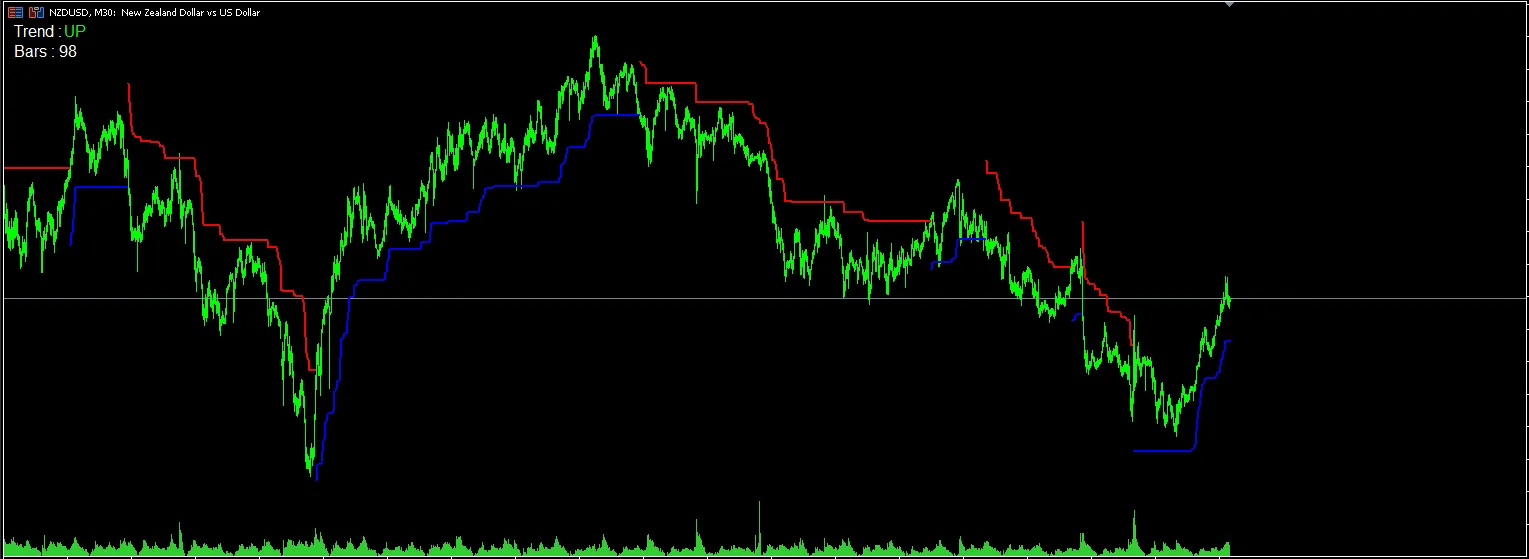
SuperTrend Indicator – Precise Trend Detection Made Simple Overview The SuperTrend Indicator is a fa...
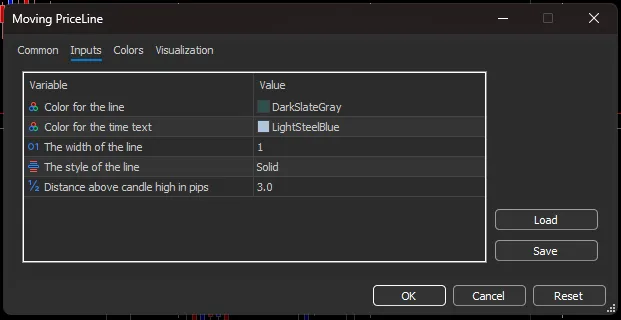
If you've ever found yourself waiting for the perfect moment to execute a trade, the Moving Price Li...
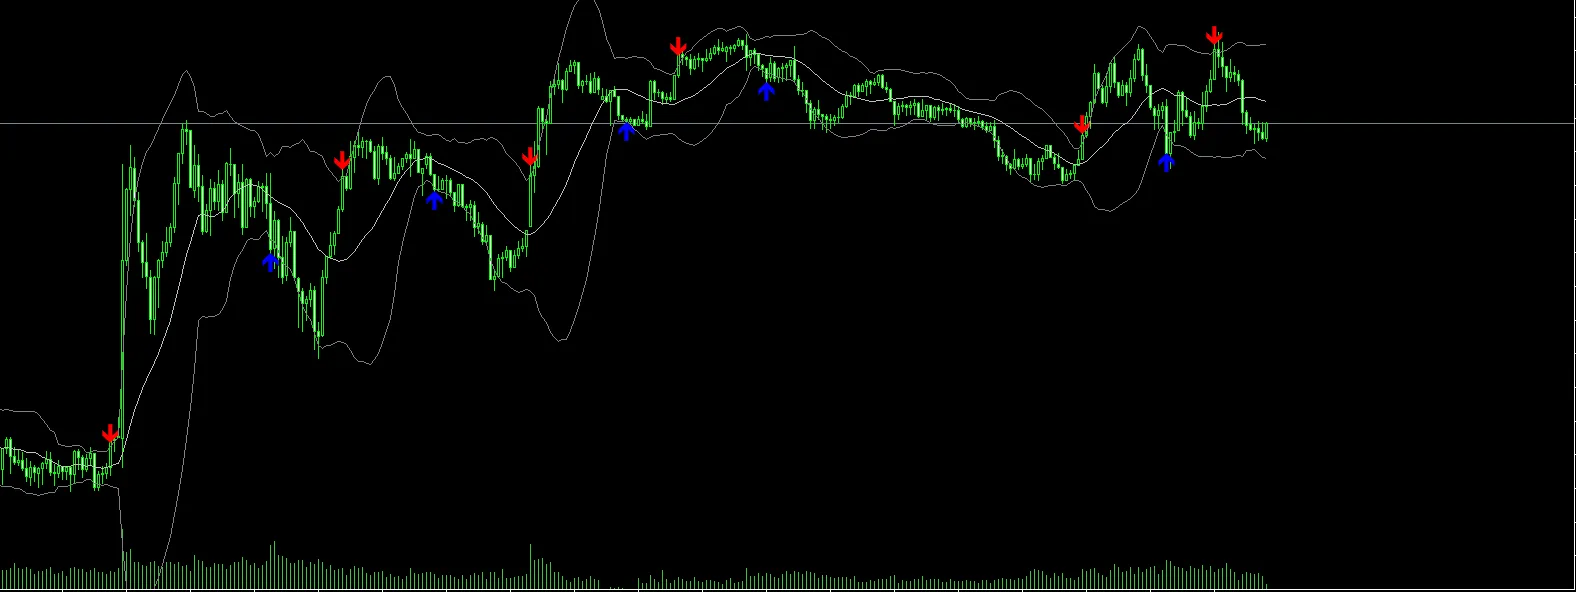
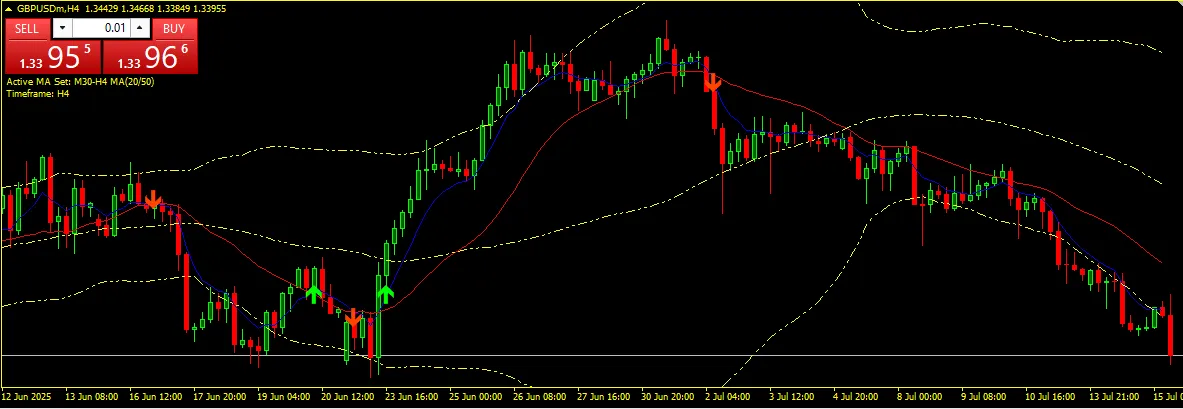
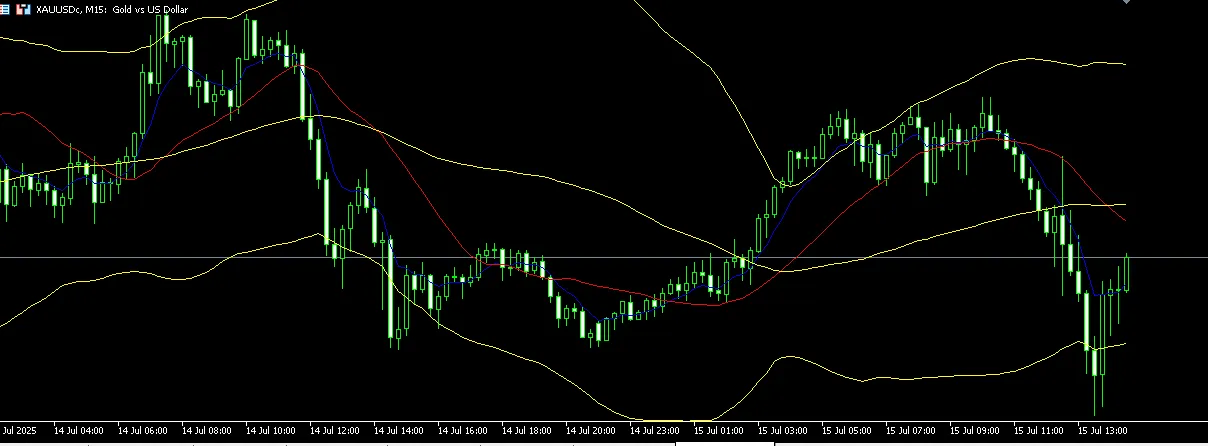
2 Moving Averages with Bollinger Bands is an incredibly versatile technical analysis tool for MetaT...
Are you looking to level up your trading game? The 2 Moving Averages with Bollinger Bands indicator ...