Technical Indicator

Mastering Market Moves: Understanding the Volatility Indicator
MetaTrader4
Mastering Market Moves: Understanding the Volatility Indicator

Description: 
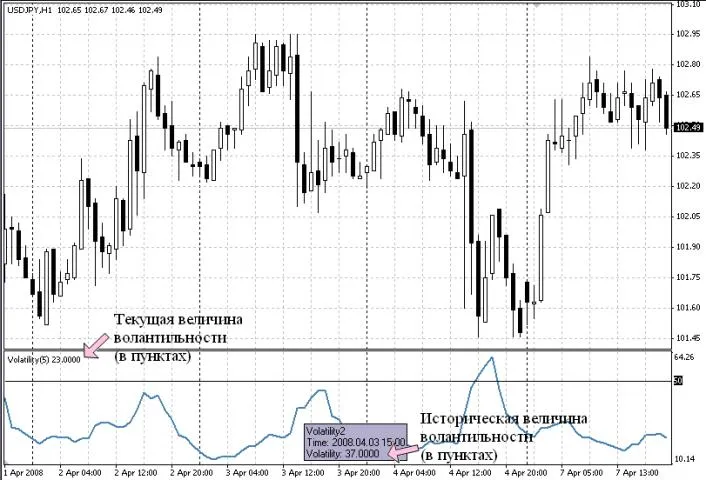
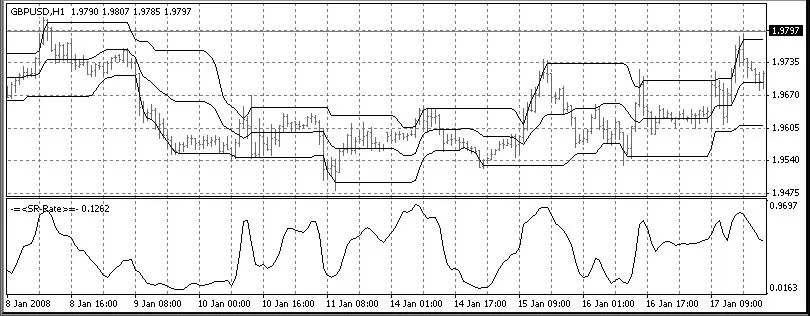
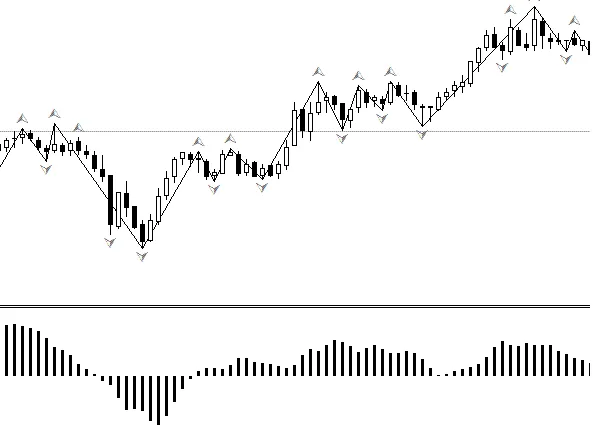
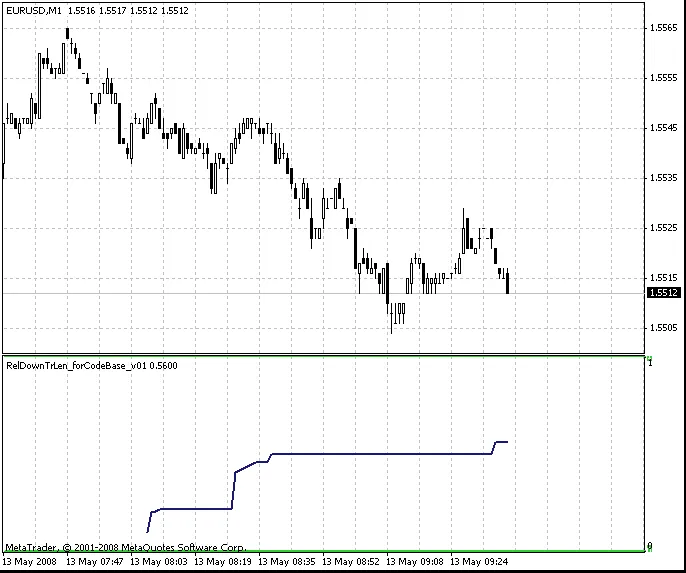
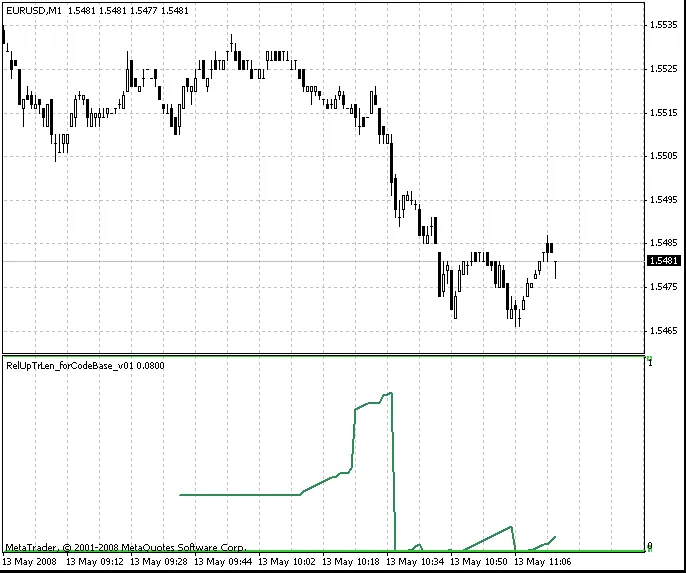
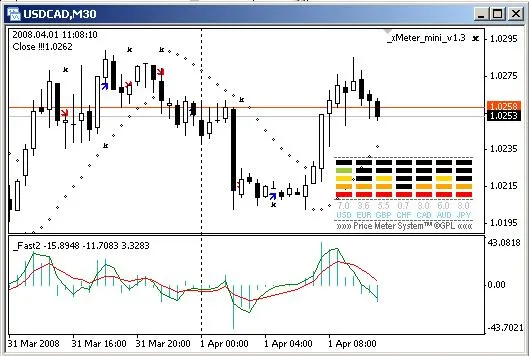
If you're diving into the world of trading, understanding volatility is key. This simple indicator calculates the volatility of a specific currency pair or any other security available in your trading terminal. It measures volatility in points based on the High and Low prices, not the Open or Close. The current volatility level is displayed in the upper left corner of the indicator window. To see the historical values, simply hover your cursor over the volatility chart. The indicator allows for several adjustments: Averaging Period: By default, this is set to 5 periods, which means the volatility is averaged over the last 5 periods. 
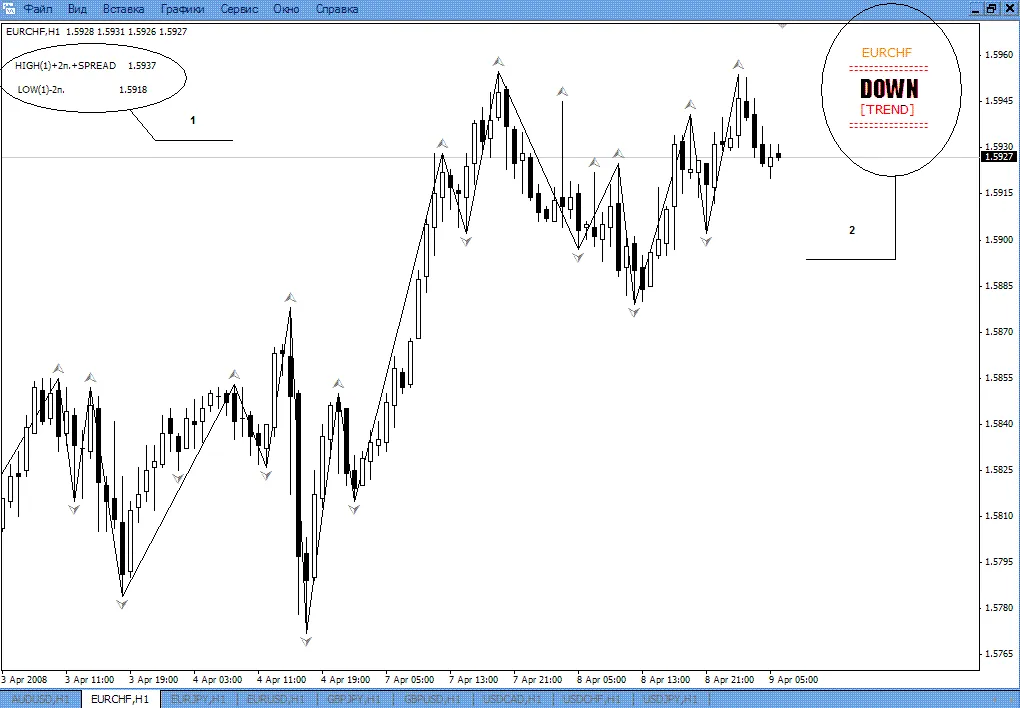
Important Levels: You can set a volatility threshold below which entering the market may not be advisable. For volatile pairs like GBPJPY, default levels are set at 50, 100, 200, 300, and 400 points. Customization: You can modify the drawing lines and colors of the indicator for better visibility. Understanding the Calculation: Volatility is calculated using a straightforward average formula: the sum of High prices over the averaging period minus the sum of Low prices, expressed in points: (IMA (High, 5) - IMA (Low, 5)) * 100 In this formula: High and Low represent the highest and lowest prices during the period. 5 is the default averaging period, but you can adjust this as needed. 100 converts the result into points, depending on the number of decimal places in the currency pair (for example, 100 for pairs quoted with JPY, and 10,000 for other pairs). 
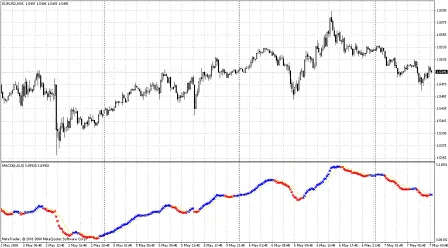
It's crucial to evaluate symbols based on their volatility. You might want to focus on the most or least volatile pairs to optimize your trading strategy. For that, you can use the Volatility 3 Pairs.mq4 indicator: This indicator is tailored to assess the volatility of three specific pairs: GBPUSD, USDJPY, and GBPJPY. No matter which chart you attach it to, it will calculate volatility solely for these pairs. If you need to adjust the pairs, you can easily do so by editing the program in MetaEditor: Make sure to update the relevant sections in the code: Additionally, you can increase the number of symbols for volatility calculation, just remember to add the appropriate buffers (up to a maximum of 8) and make the necessary code adjustments.

2008.05.18
Understanding Support and Resistance: Key Indicators for Traders
MetaTrader4
Understanding Support and Resistance: Key Indicators for Traders

Hey fellow traders! Today, I want to dive into two essential indicators that can really help you navigate the markets: the Support-Resistance Indicator and the SR-Rate Indicator. Support-Resistance Indicator As the name suggests, the Support-Resistance Indicator is designed to pinpoint and display those crucial support and resistance levels on your charts. The midline you see is essentially the average value between support and resistance, giving you a clearer picture of market dynamics. You can customize the indicator's window width. For example, if you want to see daily levels on a one-hour chart, simply set the window width to 24. SR-Rate Indicator The SR-Rate Indicator highlights which side of the price range the market is leaning towards, helping you make more informed trading decisions. Setup Instructions Make sure to place the OneSideGaussian file in your libraries folder. Store the other two files in your indicators folder. In my opinion, using these indicators together will give you the best results. They complement each other nicely and can enhance your trading strategy. I apologize for the brief explanations, but I believe you can easily navigate through the 10 KB of code on your own. I’ve made an effort to write clearly, with variable names that reflect their purpose. I’m really excited to hear your thoughts and feedback on this program, especially since this is my first contribution here. Let’s share ideas and grow together as traders!

2008.05.17
Mastering ZigZag Patterns: Your Guide to Smooth Trading
MetaTrader4
Mastering ZigZag Patterns: Your Guide to Smooth Trading

Special Features: Search for ZigZag (ZZ) breaks—only at the peaks or troughs of the approximating curve (I like to call it the Snake). We ignore other extremums since they’re not relevant. The ZZ is calculated on a larger timeframe (handled by the file SZZ_without_ZZ.mq4) and displayed on a smaller one (using SZZReader.mq4). This setup reduces the number of "redraws" and helps us skip unnecessary breaks, avoiding some artificial stop-level touches. Plus, it allows for better measurement of horizontal projections on the smaller timeframe. During formation, the ZZ section doesn’t pull back from the reached levels like the price does. Instead, it locks them in to keep the proportions of shape development intact. If there’s a turn, a new ZZ break will emerge at the latest reached level, and this "alternative" development gets fixed with a "rubber-band". This setup allows us to track how patterns develop: And, when we detect a possible new ZZ break, we can evaluate the likelihood of completing the pattern by comparing it with turning shapes: To get started with the program, save both files, SZZ_without_ZZ.mq4 and SZZReader.mq4, in your indicators folder. Open them in MetaEditor and compile. These programs are designed for use in the Tester, but they should also work in real-time (fingers crossed!). To use them, load SZZReader in your current window. The parameter SeniorTF sets the timeframe for ZZ calculation. Make sure there are quotes available from a larger timeframe to build ZZ on your selected one. For instance, if you want to calculate ZZ on H1 and display it on M5, start SZZReader in the M5 window, specifying extern int SeniorTF = 60;. Note: The attached indicators are basic; they only draw the ZZ itself and the "rubber-band". You won’t find templates for turning shapes, pattern search functions, or additional calculations between ZZ breaks in these indicators.

2008.05.17
Enhance Your Trading with a Custom Trend Estimator
MetaTrader4
Enhance Your Trading with a Custom Trend Estimator

Hey fellow traders! Today, I’m excited to share a handy trend estimator I’ve developed that tackles a common issue we face with traditional averaging methods. You know how regular averages can lag behind, only giving insights about events half the averaging period in the past? Well, this tool aims to change that! How It Works This trend estimator employs an algorithm similar to the one used in the MT STD channel. It fits a straight line over a fixed number of periods and provides the latest point along with two deviation channels. The width of these channels can be adjusted based on your preferences. Pretty neat, right? Important Notes New to MQL4: I’m still learning the ropes of MQL4 programming (though I have some background in programming), so I’m open to feedback! If you spot any code errors or have suggestions for optimization, please let me know, and I’ll make the necessary changes. Geometric vs. Linear Averaging: I prefer geometric averaging over linear averaging for its reduced sensitivity to outliers. However, you can switch this up in the function “get_avg” if that’s your jam. Best Timeframes: From my experience, this estimator works like a charm on hourly charts over 5 days (120 points) or on 4-hour charts over 20 days (also 120 points). Deviation Channels: Just a heads up, the deviation channels here aren’t standard channels. The deviations above and below the trend are calculated separately, and while I do my best, stats isn’t my strong suit, so they might not be perfect! Happy trading, and I look forward to hearing your thoughts on this tool!

2008.05.16
Mastering Order Calculations with the Graphical Calculator Indicator
MetaTrader4
Mastering Order Calculations with the Graphical Calculator Indicator

The Graphical Calculator is a handy tool designed specifically for traders to streamline the order calculation process. With this indicator, you can easily set up three key lines on your chart: OPEN, STOP, and PROFIT. These lines represent the price levels where you plan to open a trade (OPEN), set a Stop Loss (STOP), and take profit (PROFIT). If these lines aren’t already present on your chart, don’t worry! The indicator will create them automatically, positioning them near the current market price. To ensure accurate calculations, you’ll need to configure a few settings in the indicator properties: Set the volume for opening positions using calc_lots. Input the commission amount (comission) for Futures and CFDs, which is calculated in dollars per lot for Futures and as a percentage per share for CFDs. Remember, if one lot in CFD equals 100 shares, set the stock_in_lot parameter to 100. For symbols that calculate profits in euros or pounds (like FDAX or FTSE), make sure you have the EURUSD or GBPUSD pairs displayed in your Market Watch. This will allow the indicator to pull the necessary rates automatically. For cross-currency pairs (like GPBJPY), ensure the corresponding USD pairs (like USDJPY) are also open in the Market Watch. Once you’ve positioned your SL and TP lines, the indicator will automatically display the potential profits (in dollars) for your TP, losses for your SL, and the required margin for the specified lot size in the upper left corner of the chart. Plus, it will draw a StopOut line that will activate once it’s reached. To recalculate values, simply drag the lines around on your chart. It's that easy! Calculator's Appearance in the Chart Recommendations: Values are updated with each new tick. If you're working with low-liquidity securities or during breaks between trading sessions, right-click on the chart and select "Update" to refresh the values. To identify your lines easily, enable "Show object descriptions" in the chart properties. The lines created by the indicator are standard graphical objects, so you can customize their color, thickness, and hatch type by accessing the "Object List" from the right-click menu on the chart.

2008.05.15
Unlock Trading Success with the Fast Oscillator 2 Indicator
MetaTrader4
Unlock Trading Success with the Fast Oscillator 2 Indicator

Hey there, fellow traders! Today, I want to dive into an interesting tool that can give your trading strategy a boost: the Fast Oscillator 2 indicator. This nifty little tool analyzes the last three bars using a quadratic function and presents the results as a histogram. Pretty cool, right? What’s great about the Fast Oscillator 2 is its dual moving averages, which you can tweak in the settings to fit your trading style. Plus, I’ve added optional sound alerts that will notify you whenever the signal lines are touched. Talk about a handy feature! For those of you who are looking for even more functionality, check out the Fast 3 indicator. It works similarly to the Fast Oscillator 2 but adds alerts directly in the price field with corresponding arrows. This can be super useful for keeping an eye on key signals without getting overwhelmed. Now, let’s talk about performance. I designed this indicator because I wanted a reliable oscillator that doesn’t suffer from delays or constant redrawing. While it does lag one bar behind the price, the good news is that it remains consistent and won’t redraw itself like some other oscillators out there. In fact, it’s two bars faster than your typical MACD, making it a solid choice for those quick trades. However, a word of caution: due to its high sensitivity, it’s best to pair the Fast Oscillator 2 with a low-frequency filter, especially in a flat market. This way, you can avoid getting whipsawed by false signals. In summary, the Fast Oscillator 2 is a valuable addition to any trader’s toolkit, offering both speed and reliability without the hassle of constant redrawing. Give it a try, and see how it can enhance your trading strategy!

2008.05.14
Mastering the Market: The Return of Rook Strategies
MetaTrader4
Mastering the Market: The Return of Rook Strategies

Understanding Rook Strategies in Trading Hey fellow traders! Today, we’re diving into a fascinating topic that's been making waves in the trading community—rook strategies. If you’re looking to sharpen your skills and enhance your trading game, you're in the right place! What Are Rook Strategies? Rook strategies are essentially tactics that help traders navigate the complexities of market movements. Named after the chess piece, these strategies emphasize positioning and foresight. Just like in chess, where you anticipate your opponent's moves, in trading, it’s all about predicting market trends. Why Are Rook Strategies Making a Comeback? In recent months, many traders have started revisiting these strategies. Here’s why: Market Volatility: With the markets being as unpredictable as ever, rook strategies provide a structured approach to manage risks. Improved Technology: The rise of advanced trading platforms and tools makes implementing these strategies easier than before. Community Insights: Traders are sharing their success stories, creating a buzz around rook tactics. How to Implement Rook Strategies Ready to give these strategies a whirl? Here are some tips to get you started: Stay Informed: Keep an eye on market news and trends. Knowledge is power! Practice with Simulations: Use demo accounts to test your strategies without risking real money. Join Trading Communities: Engage with other traders to share insights and experiences. Final Thoughts Rook strategies are not just a revival; they’re a testament to the evolving landscape of trading. Whether you're a novice or a seasoned trader, incorporating these tactics can give you an edge in the market. So, gear up and start exploring the potential of rook strategies!

2008.05.12
Mastering Clear Exchange Transactions: A Trader's Guide
MetaTrader4
Mastering Clear Exchange Transactions: A Trader's Guide

When it comes to trading, one of the key aspects that often gets overlooked is the importance of clear exchange transactions. Whether you're a seasoned pro or just dipping your toes into the trading waters, understanding how to execute and manage your transactions effectively can make all the difference in your trading success. What Are Clear Exchange Transactions? In simple terms, clear exchange transactions refer to the processes that ensure your trades are executed smoothly and transparently. This involves everything from placing your orders to settling them without any hiccups. Here are a few things to keep in mind: Execution Speed: In the fast-paced world of trading, speed is crucial. Ensure your platform allows for quick transactions to capitalize on market movements. Transparency: Always know what fees you're dealing with. Hidden costs can eat into your profits faster than you can say "slippage." Reliability: Choose brokers and platforms with a solid reputation for executing trades accurately and efficiently. Why It Matters Clear exchange transactions are not just a technicality; they're the backbone of your trading strategy. When you can trust that your trades will go through as intended, you can focus on what really matters—making informed decisions and maximizing your returns. Tips for Smooth Transactions Stay Informed: Keep up with market trends and news that may impact your trades. Use a Reliable Trading Platform: Make sure your trading system is robust and user-friendly. Practice Good Risk Management: Set stop-loss orders to protect your investments. In conclusion, mastering clear exchange transactions is essential for any trader looking to thrive in today's market. By focusing on execution speed, transparency, and reliability, you can ensure that your trading experience is as smooth as possible. Happy trading!

2008.05.12
First Previous 365 366 367 368 369 370 371 372 373 374 375 Next Last