Technical Indicator

Unlocking the Power of OzFx Signals v1.7 for Smarter Trading
MetaTrader4
Unlocking the Power of OzFx Signals v1.7 for Smarter Trading

Hey traders! Today, let's dive into the OzFx Signals v1.7 indicator and see how it can help elevate your trading game. Key Features of OzFx Signals v1.7 This powerful tool is designed to give you insights into various currency pairs, making it easier to spot trading opportunities. Here’s a quick rundown of its parameters: PairsList: "EURUSD, EURGBP, EURCHF, USDJPY, AUDUSD, EURJPY, GBPUSD, USDCAD, USDCHF, NZDUSD, CHFJPY, CADJPY, EURAUD, EURCAD, GBPCHF, AUDJPY, AUDNZD" - Customize your currency pairs here. SymbolSuffix: "" - If your broker uses a suffix for mini accounts (like an 'm'), enter it here. ShowTimeTillNextBar: True - Keep track of time until the next bar. 
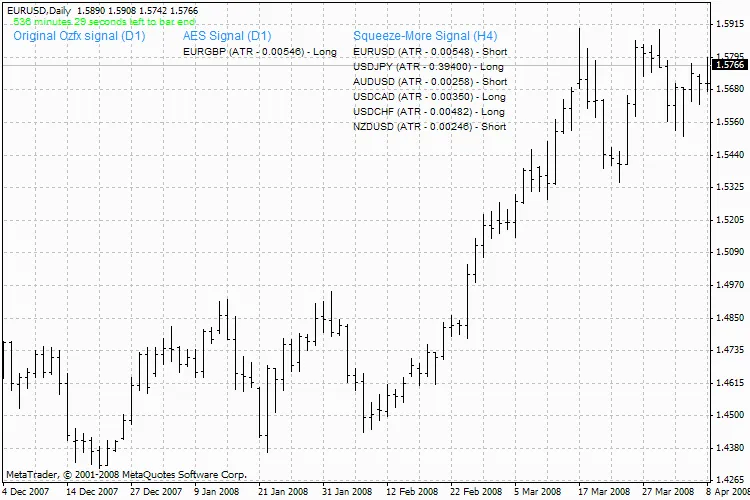
ShowAESSignal: True - Get alerts for trade signals. Show4HoursSqueezeMore: True - Use the Squeeze More feature for better insights. 
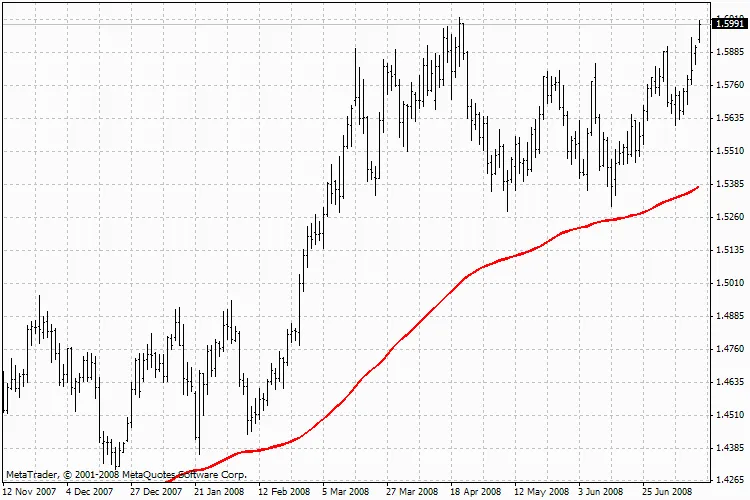
SMAFilterOriginal: False - Use the original method with the Simple Moving Average (SMA). SMAFilterAES: False - Another filter option with the SMA. SMAFilterPeriod: 200 - Set your SMA period. 
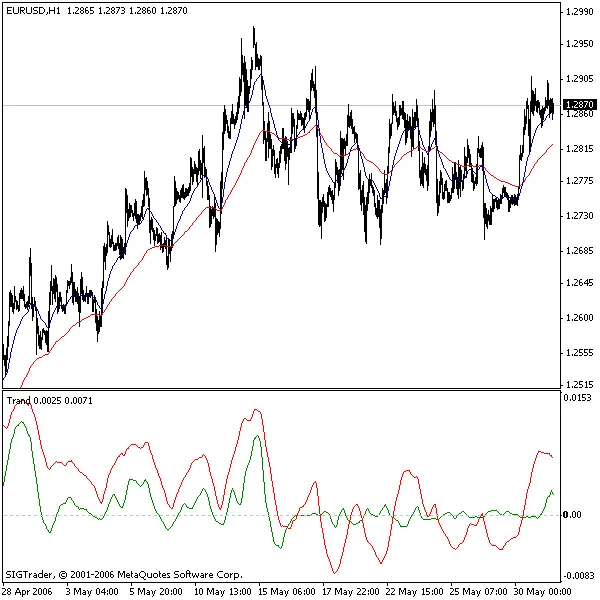
StochKPeriod: 5 - Configure the Stochastic K period. StochDPeriod: 3 - Set the Stochastic D period. StochSlowing: 3 - Adjust the slowing factor. ATRPeriod: 5 - Set the Average True Range period. 
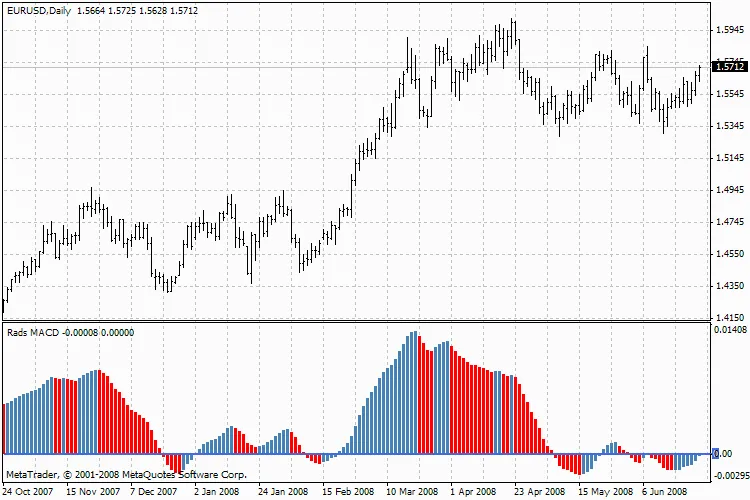
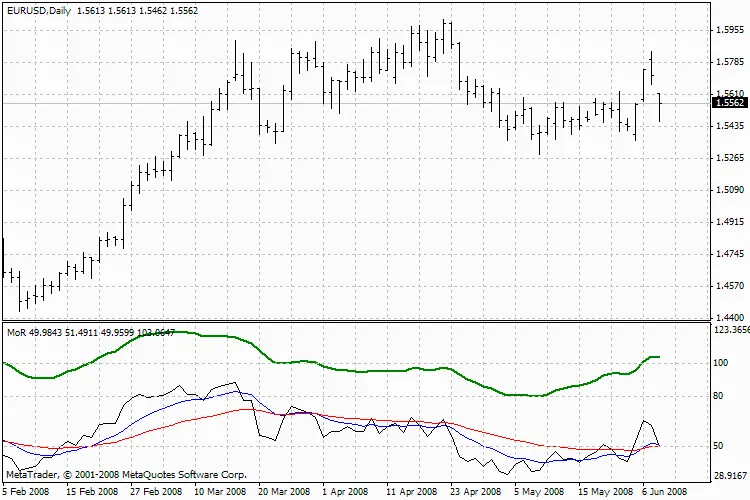
OriginalAndAESTF: 1440 - This parameter specifies the timeframe for signals: 1, 15, 30, 60, 240, with the default set to Daily (D1). 
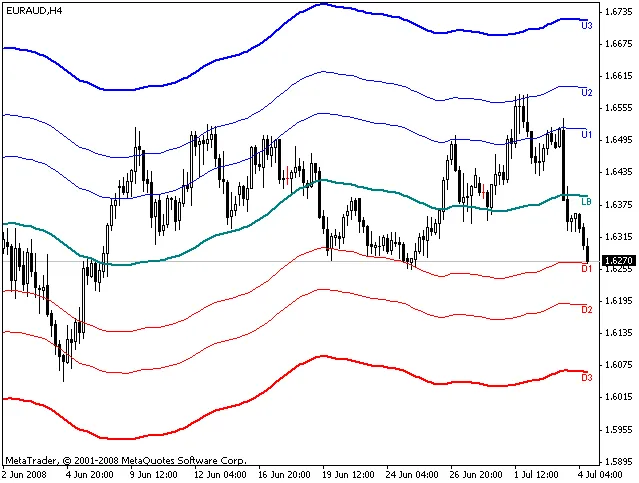
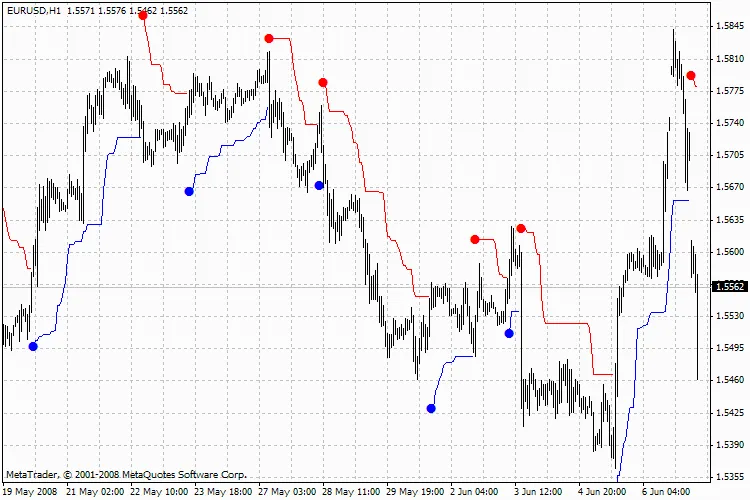
SqueezeMoreTF: 240 - This is the timeframe for the Squeeze More feature, with a default of H4. OzFx Signals v1.7 So there you have it, folks! The OzFx Signals v1.7 is a handy indicator that can help you make more informed decisions in your trading. Don't forget to customize it to suit your trading style!

2008.07.25
Mastering the Rads MACD Indicator for Better Trading Decisions
MetaTrader4
Mastering the Rads MACD Indicator for Better Trading Decisions

If you're looking to elevate your trading game, the Rads MACD indicator is a fantastic tool to consider. This indicator helps traders identify potential buy and sell signals, making it a staple in many trading strategies. Rads MACD What is the Rads MACD? The Rads MACD (Moving Average Convergence Divergence) is a momentum indicator that shows the relationship between two moving averages of a security's price. Typically, this indicator is used to spot changes in the strength, direction, momentum, and duration of a trend in a stock's price. Why Use the Rads MACD? Trend Identification: It helps you to spot whether the market is in an uptrend or downtrend. Signal Generation: The Rads MACD provides clear signals for buying and selling, allowing you to make informed decisions. Diverse Applications: You can apply the Rads MACD across various markets, including Forex, stocks, and commodities. How to Interpret the Rads MACD Understanding the Rads MACD is fairly straightforward. It consists of two lines and a histogram: The MACD Line: This is the difference between the 12-day and 26-day exponential moving averages (EMAs). The Signal Line: A 9-day EMA of the MACD line, which helps to smooth out the data. The Histogram: Represents the difference between the MACD line and the signal line, indicating momentum. By keeping an eye on these elements, you can better gauge market conditions and adjust your strategies accordingly. In conclusion, the Rads MACD is a powerful tool that can assist you in making more informed trading decisions. Whether you're a seasoned trader or just starting out, incorporating this indicator into your toolkit could give you the edge you need.

2008.07.21
Unlock Trading Insights with the WSO + WRO + Trend Line Indicator for MT4
MetaTrader4
Unlock Trading Insights with the WSO + WRO + Trend Line Indicator for MT4

Hey fellow traders! I'm excited to share my latest creation with you all—the WSO + WRO + Trend Line Indicator for MetaTrader 4. If you're eager to enhance your trading game, you can grab it here: Download the Indicator. For a sneak peek and some insights, check out the screenshot here. Although this indicator has been in the works for nearly two years, I've only recently discovered its potential through a bit of trial and error. Let me break it down for you: Understanding the WSO + WRO + Trend Line Indicator Foundation: This indicator is built on the Widners Oscillator, giving it a solid technical base. Support and Resistance: It features horizontal lines—6 red lines indicating support (WSO) and 6 blue lines indicating resistance (WRO). Trend Lines: Trend lines are drawn based on the upward points of WSO and WRO rather than fractals, providing a different perspective. Triangle Formation: Occasionally, the trend lines (Trend UP0 and Trend DN0) will intersect to form a triangle. The angle of this triangle can indicate the target price movement and the estimated time it might reach that level. My observations suggest that the price tends to hit these targets a bar or two earlier. Price Action Signals: If the price breaks above or below the last WSO/WRO point, the target is considered invalid. Check point 3 on the screenshot for clarity. Trend Reversal Indicator: As long as the price doesn’t break through the triangle’s angle, it could signal a trend reversal—this might be your cue to jump into the market! Breakouts: A breakout above or below any line indicates the potential for continued price movement in that direction. There’s a lot to unpack, and I’m sure I might have missed a few details, so feel free to ask questions! For further discussions, swing by my forum here. Just a heads up—please avoid private messages; it’s easier for me to keep track of everything in the forum.

2008.07.18
Understanding the MoR Indicator for Enhanced Trading Strategies
MetaTrader4
Understanding the MoR Indicator for Enhanced Trading Strategies

Hey fellow traders! Today, let's dive into the MoR indicator and see how it can enhance your trading strategies. What is the MoR Indicator? The MoR (Momentum Relative) indicator is designed to help you gauge market momentum and make more informed trading decisions. It combines the power of the RSI (Relative Strength Index) with moving averages to give you a clearer picture of market trends. Key Settings for the MoR Indicator Here’s a breakdown of the key parameters you can customize for the MoR indicator: RSI_Timeframe: Set this to 0 for the current chart, or choose from other timeframes like 1 (M1), 5 (M5), 15 (M15), 30 (M30), 60 (H1), or 240 (H4). RSI_Period: This is typically set to 10, which is a good balance for many traders. RSI_Applied_Price: Choose how to apply the RSI based on price types (0 = close, 1 = open, 2 = high, 3 = low, 4 = (high + low) / 2, 5 = (high + low + close) / 3, 6 = (high + low + close + close) / 4). MA1_Period: This is also commonly set to 10 for the first moving average. MA1_Method: Choose the type of moving average to use: 0 for SMA, 1 for EMA, 2 for SMMA, or 3 for LWMA. MA2_Period: A typical setting here is 30 for the second moving average. MA2_Method: Similar to MA1, choose your preferred moving average method. Visual Representation MoR Indicator By tweaking these settings, you can tailor the MoR indicator to fit your trading style and improve your chances of success in the market. Happy trading!

2008.07.18
First Previous 361 362 363 364 365 366 367 368 369 370 371 Next Last