Hey fellow traders! Today, let's dive into the MoR indicator and see how it can enhance your trading strategies.
What is the MoR Indicator?
The MoR (Momentum Relative) indicator is designed to help you gauge market momentum and make more informed trading decisions. It combines the power of the RSI (Relative Strength Index) with moving averages to give you a clearer picture of market trends.
Key Settings for the MoR Indicator
Here’s a breakdown of the key parameters you can customize for the MoR indicator:
- RSI_Timeframe: Set this to 0 for the current chart, or choose from other timeframes like 1 (M1), 5 (M5), 15 (M15), 30 (M30), 60 (H1), or 240 (H4).
- RSI_Period: This is typically set to 10, which is a good balance for many traders.
- RSI_Applied_Price: Choose how to apply the RSI based on price types (0 = close, 1 = open, 2 = high, 3 = low, 4 = (high + low) / 2, 5 = (high + low + close) / 3, 6 = (high + low + close + close) / 4).
- MA1_Period: This is also commonly set to 10 for the first moving average.
- MA1_Method: Choose the type of moving average to use: 0 for SMA, 1 for EMA, 2 for SMMA, or 3 for LWMA.
- MA2_Period: A typical setting here is 30 for the second moving average.
- MA2_Method: Similar to MA1, choose your preferred moving average method.
Visual Representation
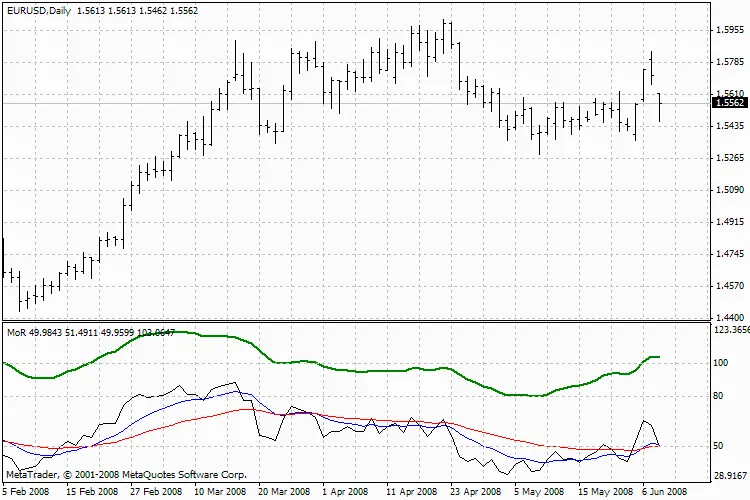
MoR Indicator
By tweaking these settings, you can tailor the MoR indicator to fit your trading style and improve your chances of success in the market. Happy trading!
Related Posts
- Unlocking MetaCOT 2: Your Ultimate CFTC Indicator Toolkit for MT4
- Unlocking the Power of Master Tools for MetaTrader 4
- Mastering the Open Range Breakout Indicator for MetaTrader 5
- Visualize Current Trends Across All Time Frames with This MetaTrader 4 Indicator
- Unlocking the Power of Multi-Timeframe Tymen STARC Bands for MetaTrader 5