Technical Indicator

Maximize Your Trading with FisherTransform_HTF_Signal for MetaTrader 5
MetaTrader5
Maximize Your Trading with FisherTransform_HTF_Signal for MetaTrader 5

The FisherTransform_HTF_Signal is your go-to indicator for spotting trend directions and generating trading signals right on your MetaTrader 5 platform. It utilizes the Fisher Transform indicator to provide clear, visual cues about market movements, complete with color-coded arrows and alert features for optimal trading moments. When a trend is in play at the selected bar, you'll see a right arrow pop up, colored to reflect the direction of the trend. Conversely, if the trend shifts at that bar, an arrow will appear indicating the new trend direction, helping you make informed trading decisions. All input parameters for the FisherTransform_HTF_Signal can be categorized into three main groups: Fisher Transform Indicator Input Parameters://+------------------------------------------------+ //|  Indicator input parameters                   | //+------------------------------------------------+ input string Symbol_="";                  // Financial instrument input ENUM_TIMEFRAMES Timeframe=PERIOD_H6; // Timeframe for the indicator calculation input uint Length=10;                      // Indicator period Visualization Input Parameters for FisherTransform_HTF_Signal://---- indicator display settings input uint SignalBar=0;                              // Signal bar index, 0 is the current bar input string Symbols_Sirname=INDICATOR_NAME"_Label_";// Indicator labels name input color UpSymbol_Color=Teal;                     // Growth symbol color input color DnSymbol_Color=DarkOrange;               // Downfall symbol color input color IndName_Color=DarkOrchid;                // Indicator name color input uint Symbols_Size=60;                          // Signal symbols size input uint Font_Size=10;                             // Indicator name font size input int X_1=5;                                     // Horizontal shift of the name input int Y_1=-15;                                   // Vertical shift of the name input bool ShowIndName=true;                         // Indicator name display input ENUM_BASE_CORNER WhatCorner=CORNER_RIGHT_UPPER;// Location corner input uint X_=0;                                    // Horizontal shift input uint Y_=20;                                    // Vertical shift Alert and Audio Signal Parameters://---- alerts settings input ENUM_ALERT_MODE alert_mode=OnlySound; // Alert indication mode input uint AlertCount=0;                    // Number of alerts to be triggered If you plan on using multiple FisherTransform_HTF_Signal indicators on the same chart, make sure each one has a unique Symbols_Sirname variable to avoid any confusion. To get started, simply place the compiled Fisher Transform indicator file in your terminal's data folder under MQL5\Indicators\. Fig. 1. Sell signal Fig. 2. Uptrend continuation signal

2012.02.04
Unlocking the Power of UltraCCI Indicator for MetaTrader 5
MetaTrader5
Unlocking the Power of UltraCCI Indicator for MetaTrader 5

Author: dm34@mail.ru Hey there, fellow traders! Today, let’s dive into the UltraCCI indicator, a fantastic tool for MetaTrader 5 that leverages the Commodity Channel Index (CCI) to analyze trend directions effectively. This will help you make more informed trading decisions! The UltraCCI indicator is built on the principles of CCI, where we analyze multiple signal lines to determine market trends. Here’s a quick breakdown of the key input parameters you’ll be working with: StartLength: The initial value for the first signal line. Step: This defines how much the period changes with each step. StepsTotal: The total number of period changes you want to analyze. The calculation for any period from the signal lines uses an arithmetic progression: SignalPeriod(Number) = StartLength + Number * Step Here, the variable Number ranges from zero to StepsTotal. Once we have these period values, they’re compiled into an array, which is used to derive smoothed RSI values. Next, we calculate the trend direction for each smoothing and tally the positive and negative trends across all CCI smoothed values. The results are then smoothed again to create the indicator lines that form a color cloud, displayed using the DRAW_FILLING style. The direction of the trend is depicted by the cloud's color, while the strength of that trend is indicated by the cloud's width. You can also set overbought (UpLevel) and oversold (DnLevel) levels as a percentage of the indicator's maximum amplitude. Additionally, this indicator allows you to gauge the speed of trend power changes, represented by color dots. If the trend power is increasing, these dots will match the cloud's color; otherwise, they’ll display in the opposite color. There are ten different smoothing algorithms available for you to choose from: SMA (Simple Moving Average) EMA (Exponential Moving Average) SMMA (Smoothed Moving Average) LWMA (Linear Weighted Moving Average) JJMA (JMA Adaptive Average) JurX (Ultralinear Smoothing) ParMA (Parabolic Smoothing) T3 (Tillson's Multiple Exponential Smoothing) VIDYA (Tushar Chande's Algorithm) AMA (Perry Kaufman's Algorithm) It's important to note that the phase parameters for different smoothing algorithms carry distinct meanings. For example, in JMA, the phase variable ranges from -100 to +100, whereas for T3, it’s a smoothing ratio multiplied by 100 for better visualization. For AMA, the fast EMA period is set at a default value of 2. The UltraCCI indicator utilizes the SmoothAlgorithms.mqh library classes, which you'll need to copy to your terminal's data_folder/MQL5/Include. You can find a detailed explanation of these classes in the article "Averaging Price Series for Intermediate Calculations Without Using Additional Buffers". Here are the input parameters for the indicator: //+----------------------------------------------+ //| Indicator input parameters | //+----------------------------------------------+ input int CCI_Period=13;  // CCI indicator period input ENUM_APPLIED_PRICE Applied_price=PRICE_CLOSE; // Applied price //---- input Smooth_Method W_Method=MODE_JJMA;  // Smoothing method input int StartLength=3;  // Initial smoothing period input int WPhase=100;  // Smoothing parameter //---- input uint Step=5;  // Period change step input uint StepsTotal=10;  // Number of period changes //---- input Smooth_Method SmoothMethod=MODE_JJMA;  // Smoothing method input int SmoothLength=3;  // Smoothing depth input int SmoothPhase=100;  // Smoothing parameter //---- input uint UpLevel=80;  // Overbought level, %% input uint DnLevel=20;  // Oversold level, %% input color UpLevelsColor=DarkViolet;  // Overbought level color input color DnLevelsColor=DarkViolet;  // Oversold level color input STYLE Levelstyle=DASHDOTDOT_;  // Levels style input WIDTH LevelsWidth=Width_1;  // Levels width //+----------------------------------------------+

2012.02.02
Unlocking the X2MA_BBx3_Cloud Indicator for MetaTrader 5: A Trader's Guide
MetaTrader5
Unlocking the X2MA_BBx3_Cloud Indicator for MetaTrader 5: A Trader's Guide

If you're looking to take your trading game to the next level, the Bollinger Bands ® in the DRAW_FILLING style might just be the tool you need. This indicator presents a colorful background that enhances visibility, making it easier to interpret market movements. Input Parameters: //+-----------------------------------+ //| Indicator input parameters       | //+-----------------------------------+ input Smooth_Method MA_Method1=MODE_SMA;  // First smoothing method input int Length1=100;                   // First smoothing depth input int Phase1=15;                      // First smoothing parameter input Smooth_Method MA_Method2=MODE_JJMA; // Second smoothing method input int Length2=20;                     // Second smoothing depth input int Phase2=100;                     // Second smoothing parameter input int BandsPeriod=100;                // BB smoothing period input double BandsDeviation = 2.0;        // Number of deviations input Applied_price_ IPC=PRICE_CLOSE;     // Applied price input int Shift=0;                        // Horizontal shift of the indicator in bars input int PriceShift=0;                   // Vertical shift of the indicator in points The middle line of this indicator is derived from a universal moving average that utilizes two smoothing methods, allowing you to select from a variety of options: SMA - Simple Moving Average; EMA - Exponential Moving Average; SMMA - Smoothed Moving Average; LWMA - Linear Weighted Moving Average; JJMA - JMA Adaptive Average; JurX - Ultralinear Smoothing; ParMA - Parabolic Smoothing; T3 - Tillson's Multiple Exponential Smoothing; VIDYA - Smoothing using Tushar Chande's Algorithm; AMA - Smoothing using Perry Kaufman's Algorithm. It's essential to realize that the Phase1 and Phase2 parameters differ significantly across smoothing algorithms. For example, in JMA, it acts as an external Phase variable ranging from -100 to +100. For T3, it's a smoothing ratio multiplied by 100 for clarity, while VIDYA uses it as a CMO oscillator period. For AMA, the fast EMA period is preset at 2, and the raising power ratio is also set to 2 by default. This indicator leverages the SmoothAlgorithms.mqh library classes (make sure to copy these to the terminal_data_folder\MQL5\Include). For an in-depth explanation of using these classes, check out the article "Averaging Price Series for Intermediate Calculations Without Using Additional Buffers".

2012.02.02
Mastering the BBSqueeze Indicator for MetaTrader 5: A Trader's Guide
MetaTrader5
Mastering the BBSqueeze Indicator for MetaTrader 5: A Trader's Guide

Author: Nick Bilak The BBSqueeze is an innovative indicator for MetaTrader 5 that utilizes a unique symmetrical oscillator based on a linear regression algorithm. This is displayed as a color-coded histogram, complemented by a simple trend power indicator represented by color dots along the central zero line of the histogram. The color of the histogram bars indicates the direction of the trend. When the histogram changes color, that’s your cue for the best market entry signal. Gray dots suggest a weaker trend, while blue dots indicate a strong trend. Flexible Smoothing Options One of the standout features of the BBSqueeze is the ability to choose from ten different smoothing algorithms: SMA - Simple Moving Average; EMA - Exponential Moving Average; SMMA - Smoothed Moving Average; LWMA - Linear Weighted Moving Average; JJMA - JMA Adaptive Average; JurX - Ultralinear Smoothing; ParMA - Parabolic Smoothing; T3 - Tillson's Multiple Exponential Smoothing; VIDYA - Smoothing using Tushar Chande's algorithm; AMA - Smoothing using Perry Kaufman's algorithm. Understanding Phase Parameters It's essential to note that the Phase parameters for various smoothing algorithms have different implications. For example: JMA uses an external Phase variable ranging from -100 to +100. T3 has a smoothing ratio multiplied by 100 for better visualization. VIDYA operates on a CMO oscillator period, while AMA relies on a slow EMA period. For the AMA, the fast EMA period is fixed at a default value of 2, and the ratio of raising to the power is also set to 2. The BBSqueeze indicator employs the SmoothAlgorithms.mqh library classes (don’t forget to copy these to the terminal_data_folder\MQL5\Include). For a detailed guide on using these classes, check out the article "Averaging Price Series for Intermediate Calculations Without Using Additional Buffers". This indicator made its debut in MQL4 and was first published in the Code Base on October 1, 2007. Input Parameters //+-----------------------------------+ //| Indicator input parameters       | //+-----------------------------------+ input Smooth_Method BB_Method=MODE_EMA_;       // Histogram smoothing method input int BB_Period = 20;                        // Bollinger Bands period input int BB_Phase= 100;                         // Bollinger Bands smoothing parameter input double BB_Deviation=2.0;                   // Number of deviations input Applied_price_ AppliedPrice=PRICE_CLOSE_; // Applied price input double ATR_Period=20;                     // ATR period input double ATR_Factor=1.5;                     // ATR ratio

2012.02.02
Harnessing Ultra Momentum: Your Go-To Indicator for MetaTrader 5
MetaTrader5
Harnessing Ultra Momentum: Your Go-To Indicator for MetaTrader 5

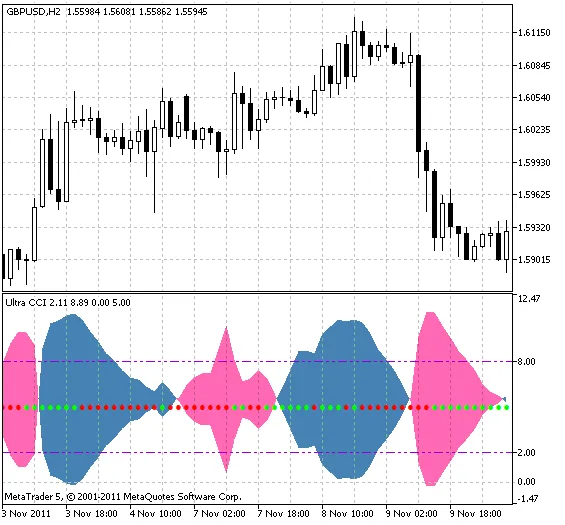
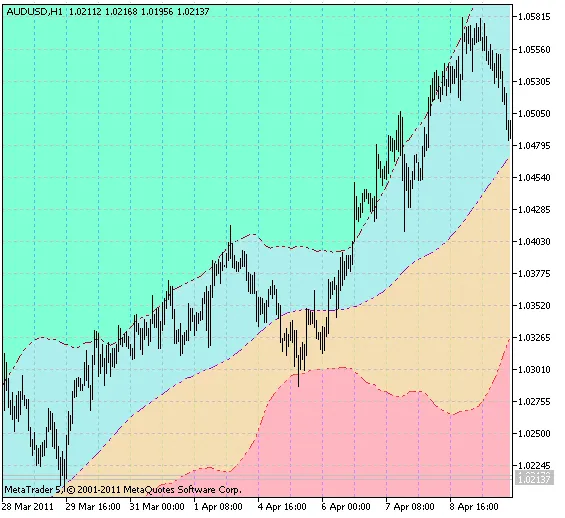
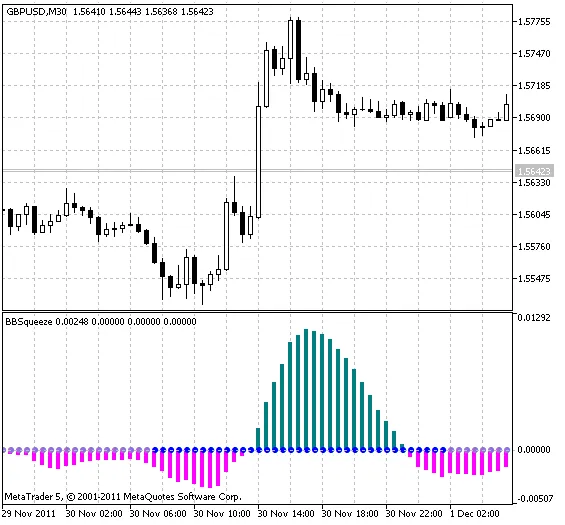
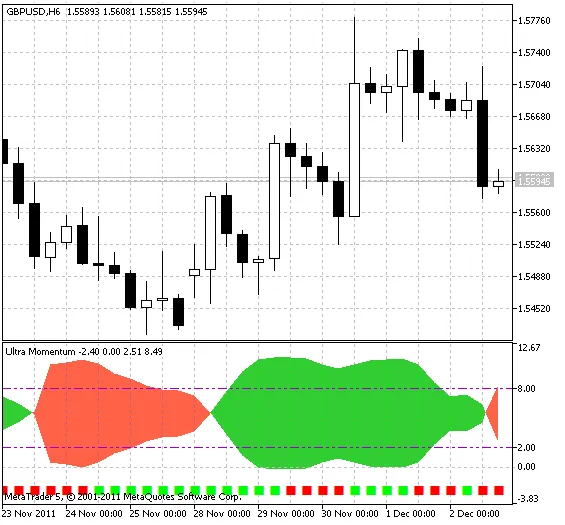
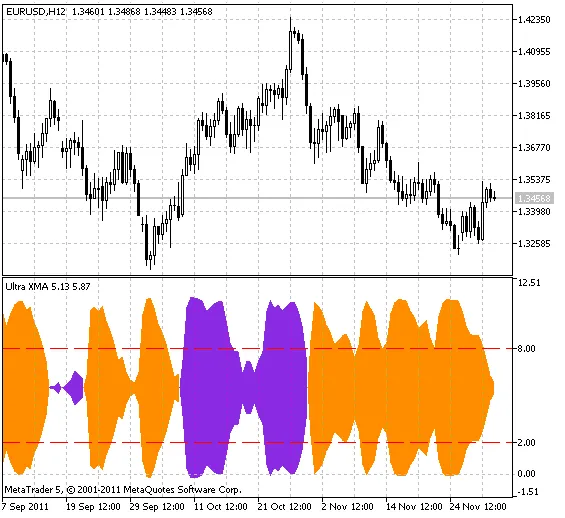
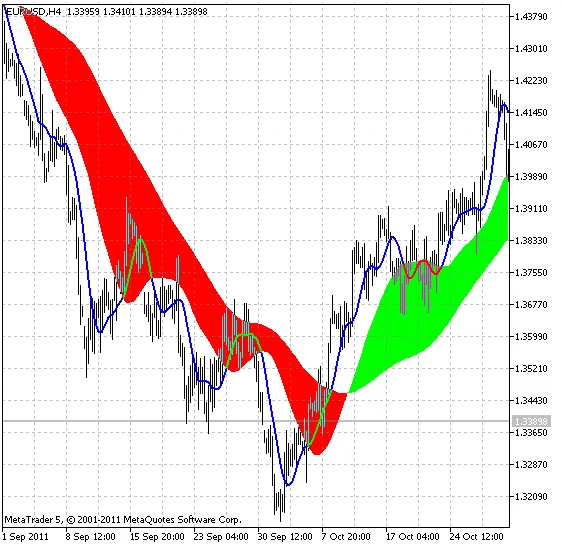
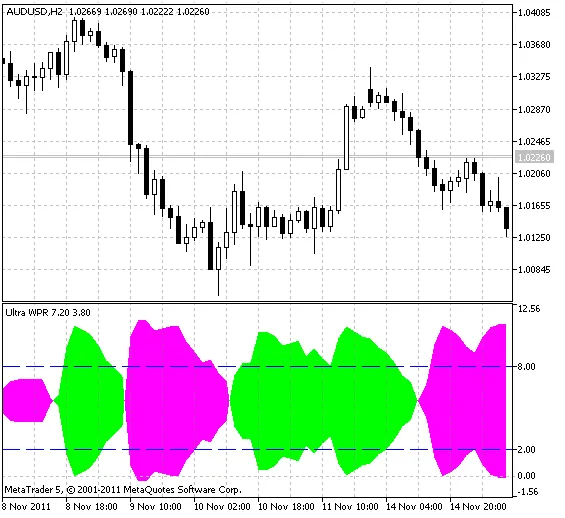
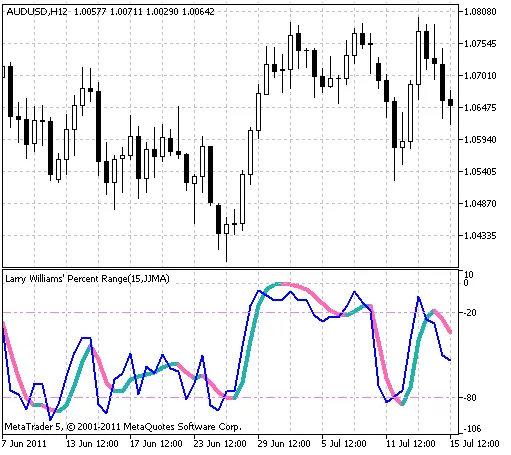
Author: dm34@mail.ru Hey there, fellow traders! Today, I want to dive into an exciting tool that can elevate your trading game: the Ultra Momentum indicator for MetaTrader 5. This nifty indicator leverages the power of Momentum and analyzes trend directions using multiple signal lines. Here’s a quick rundown of how it works. The Ultra Momentum indicator has a few key input parameters: StartLength: This sets the minimum initial value for the first signal line. Step: This is the period change step. StepsTotal: This signifies the total number of period changes. To calculate any period value from the signal lines, we use a simple arithmetic progression: SignalPeriod(Number) = StartLength + Number * Step In this formula, the Number variable ranges from zero to StepsTotal. The resulting values of these periods are collected in an array and utilized at each tick to obtain smoothed RSI values. From there, we determine the current trend direction based on these smoothings, along with the count of positive and negative trends across the entire array of smoothed RSI values. The results are then refined and used to create indicator lines that form a vibrant color cloud using the DRAW_FILLING style class. So, how do we interpret this information? The trend direction is indicated by the color of the cloud, while the strength of the trend is represented by the width of the cloud. You can also set overbought (UpLevel) and oversold (DnLevel) levels as a percentage of the indicator's maximum amplitude. Additionally, the Ultra Momentum indicator allows you to gauge the speed of trend power changes, represented by color squares. When trend power is increasing, these squares match the cloud color; when it’s decreasing, they switch to the opposite color. Now, let’s talk about the smoothing algorithms you can choose from—there are ten different versions to pick from: SMA - Simple Moving Average; EMA - Exponential Moving Average; SMMA - Smoothed Moving Average; LWMA - Linear Weighted Moving Average; JJMA - JMA Adaptive Average;JurX - Ultralinear Smoothing;ParMA - Parabolic Smoothing;T3 - Tillson's Multiple Exponential Smoothing; VIDYA - Smoothing with Tushar Chande's Algorithm; AMA - Smoothing with Perry Kaufman's Algorithm. It's important to remember that the Phase parameters for these algorithms carry different meanings. For example, in JMA, the Phase variable ranges from -100 to +100, while for T3, it’s a smoothing ratio multiplied by 100 for better clarity. In the case of VIDYA, it's tied to the CMO oscillator period, and for AMA, it refers to the slow EMA period. For other algorithms, these parameters don’t influence the smoothing process. Notably, for AMA, the fast EMA period is fixed at 2 by default, and the power ratio is also set at 2. To make the most of this indicator, you’ll need to use the SmoothAlgorithms.mqh library classes, which should be copied to the terminal_data_folder\MQL5\Include. You can find a detailed explanation of using these classes in the article "Averaging Price Series for Intermediate Calculations Without Using Additional Buffers".

2012.02.01
Unlock Trading Success with LinearRegSlope_V1_HTF_Signal for MetaTrader 5
MetaTrader5
Unlock Trading Success with LinearRegSlope_V1_HTF_Signal for MetaTrader 5

The LinearRegSlope_V1_HTF_Signal is a powerful tool for traders using LinearRegSlope_V1 on MetaTrader 5. It visually indicates market trends and signals potential trading opportunities right on your chart. You’ll receive alerts and audio cues when it’s time to enter the market, helping you make timely decisions. When the trend holds steady at your selected bar, the indicator displays a triangle pointing to the right, with its color reflecting the current trend direction. Conversely, if the trend shifts, it shows an arrow in the color and direction of the new trade signal. Here’s a breakdown of the input parameters you need to configure: Parameters from the LinearRegSlope_V1 indicator: //+------------------------------------------------+ //|  Indicator input parameters                  | //+------------------------------------------------+ input string Symbol_="";                 // Financial asset input ENUM_TIMEFRAMES Timeframe=PERIOD_H6;// Indicator timeframe for the calculation input Smooth_Method SlMethod=MODE_SMA; // Smoothing method input int SlLength=12;                 // Smoothing depth input int SlPhase=15;                  // Smoothing parameter input Applied_price_ IPC=PRICE_CLOSE;   // Price constant input uint TriggerShift=1;             // Bar shift for the trigger Parameters for visualization: //---- indicator display settings input uint SignalBar=0;                              // Signal bar index, 0 is a current bar input string Symbols_Sirname=INDICATOR_NAME"_Label_"; // Indicator labels name input color UpSymol_Color=Blue;                      // Growth symbol color input color DnSymol_Color=HotPink;                   // Downfall symbol color input color IndName_Color=DarkOrchid;                // Indicator name color input uint Symbols_Size=60;                          // Signal symbols size input uint Font_Size=10;                             // Indicator name font size input int X_1=5;                                     // Horizontal shift of the name input int Y_1=-15;                                   // Vertical shift of the name input bool ShowIndName=true;                         // Indicator name display input ENUM_BASE_CORNER  WhatCorner=CORNER_RIGHT_UPPER;// Location corner input uint X_=0;                                     // Horizontal shift input uint Y_=20;                                    // Vertical shift Parameters for alerts and audio signals://---- alerts settings input ENUM_ALERT_MODE alert_mode=OnlySound; // Type of alert input uint AlertCount=0;                     // Count of alerts sent If you're planning to use multiple LinearRegSlope_V1_HTF_Signal indicators on a single chart, make sure each one has a unique Symbols_Sirname to avoid any overlap in labels. To get started, place the compiled LinearRegSlope_V1 indicator file into your terminal's data folder under MQL5\\Indicators\. Don’t forget, this indicator relies on the SmoothAlgorithms.mqh library. Make sure to copy it to MQL5\Include\. You can find detailed explanations on how to use these classes in the article "Averaging Price Series for Intermediate Calculations Without Using Additional Buffers".

2012.02.01
Mastering the XMA Ichimoku Channel Indicator for MetaTrader 5
MetaTrader5
Mastering the XMA Ichimoku Channel Indicator for MetaTrader 5

Author: ellizii In this post, we're diving into the XMA Ichimoku Channel, an intriguing indicator for MetaTrader 5. This tool calculates moving averages just like the Ichimoku Kinko Hyo (check out XMA_Ichimoku), and builds envelopes around it. Indicator Input Parameters: //+-----------------------------------+ //| Indicator Input Parameters | //+-----------------------------------+ input uint Up_period=3; // Maximum price calculation for the period input uint Dn_period=3; // Minimum price calculation for the period //---- extern MODE_PRICE Up_mode=HIGH;  // Fetch maximum price extern MODE_PRICE Dn_mode=LOW;   // Fetch minimum price //---- input Smooth_Method XMA_Method=MODE_SMA; // Smoothing method input int XLength=100;                   // Smoothing depth                     input int XPhase=15;                     // Smoothing parameters input double Up_percent = 1.0; // Percentage deviation from the average for the upper channel band input double Dn_percent = 1.0; // Percentage deviation from the average for the lower channel band //---- input int Shift=0;      // Horizontal shift of the indicator in bars input int PriceShift=0; // Vertical shift of the indicator in points This indicator allows you to select a smoothing type from ten different versions: SMA - Simple Moving Average; EMA - Exponential Moving Average; SMMA - Smoothed Moving Average; LWMA - Linear Weighted Moving Average; JJMA - JMA Adaptive Moving Average; JurX - Ultra Linear Smoothing; ParMA - Parabolic Smoothing; T3 - Tillson Multiple Exponential Smoothing; VIDYA - Tushar Chande's Smoothing Algorithm; AMA - Perry Kaufman's Algorithmic Smoothing. It's important to note that the Phase parameter has different meanings across various smoothing algorithms. For JMA, Phase is an external variable ranging from -100 to +100. For T3, it's a smoothing ratio multiplied by 100 for better visualization. In VIDYA, it represents the CMO oscillator period, while in AMA, it indicates a slow EMA period. These parameters do not affect the smoothing of other algorithms. In AMA, the fast EMA period is set to a fixed value of 2 by default. The growth rate for AMA is also set to 2. This indicator utilizes the SmoothAlgorithms.mqh class library (which should be copied to terminal_data_folder\MQL5\Include). More details on using this class can be found in the article "Average Price Series for Intermediate Calculations Without Using Additional Buffers". Originally implemented in MQL4, this indicator was published in the Code Base on October 4, 2010.

2012.02.01
Unlocking UltraXMA: Your Go-To Indicator for MetaTrader 5
MetaTrader5
Unlocking UltraXMA: Your Go-To Indicator for MetaTrader 5

Hey there, traders! Today, we're diving into the UltraXMA indicator, designed specifically for MetaTrader 5. This nifty tool is built on the integral value of trends using a fan of moving averages with an arithmetic progression for the smoothing period. So, how does it work? The calculation algorithm for the moving averages involves a few input parameters: StartLength - This is the minimum initial value for the first signal line; Step - The period change step; StepsTotal - The total number of period changes. To calculate any period value from the fan of lines, we use the following arithmetic progression: XMAPeriod(Number) = StartLength + Number * Step Here, the Number variable ranges from zero to StepsTotal. The calculated values of the periods are stored in an array and utilized at each tick to derive the XMA moving averages fan values. The current trend direction for each smoothing is assessed, along with the count of positive and negative trends across the entire array of moving averages. The final tally of these trends is then smoothed and displayed as indicator lines, forming a color cloud with the DRAW_FILLING style class. The color of the cloud indicates the trend direction, while the width of the cloud signifies its strength. You can also set overbought (UpLevel) and oversold (DnLevel) levels as a percentage of the indicator's maximum amplitude. When it comes to smoothing algorithms, you have a choice of ten different methods: SMA - Simple Moving Average; EMA - Exponential Moving Average; SMMA - Smoothed Moving Average; LWMA - Linear Weighted Moving Average; JJMA - JMA Adaptive Average; JurX - Ultralinear Smoothing; ParMA - Parabolic Smoothing; T3 - Tillson's Multiple Exponential Smoothing; VIDYA - Smoothing using Tushar Chande's algorithm; AMA - Smoothing with Perry Kaufman's algorithm. It's worth noting that the phase parameters differ significantly across various smoothing algorithms. For instance, the JMA uses an external phase variable ranging from -100 to +100. T3 adjusts a smoothing ratio multiplied by 100 for better visualization, while VIDYA relies on the CMO oscillator period. For AMA, the slow EMA period is fixed at 2 by default. To use this indicator, you’ll need the SmoothAlgorithms.mqh library classes, which should be copied to your terminal's data folder under MQL5/Include. For more on how to utilize these classes, check out the article "Averaging Price Series for Intermediate Calculations Without Using Additional Buffers". Here are the input parameters for the indicator: //+----------------------------------------------+ //| Indicator input parameters                  | //+----------------------------------------------+ input ENUM_APPLIED_PRICE Applied_price=PRICE_CLOSE; // Applied price //---- input Smooth_Method W_Method=MODE_JJMA;     // Smoothing method input int StartLength=3;                    // Initial smoothing period                     input int WPhase=100;                       // Smoothing parameter //----   input uint Step=5;                          // Period change step input uint StepsTotal=10;                   // Number of period changes //---- input Smooth_Method SmoothMethod=MODE_JJMA; // Smoothing method input int SmoothLength=3;                   // Smoothing depth                     input int SmoothPhase=100;                  // Smoothing parameter input uint UpLevel=80;                      // Overbought level input uint DnLevel=20;                      // Oversold level input color UpLevelsColor=Red;              // Overbought level color input color DnLevelsColor=Red;              // Oversold level color input STYLE Levelstyle=DASH_;               // Levels style input WIDTH  LevelsWidth=Width_1;           // Levels width       

2012.01.31
Master the 3XMA Ichimoku Indicator for MetaTrader 5
MetaTrader5
Master the 3XMA Ichimoku Indicator for MetaTrader 5

Hey fellow traders! Today, I want to chat about the 3XMA Ichimoku indicator, a powerful tool for MetaTrader 5 that can enhance your trading strategy. This indicator combines three moving averages, drawing its calculation principles from the renowned Ichimoku Kinko Hyo. The magic happens when a couple of slow-moving averages with varying periods come together to form a "cloud". The color of this cloud indicates the trend's direction, making it a handy visual aid. Using this indicator is almost identical to utilizing the traditional Ichimoku indicator. Indicator Input Parameters //+-----------------------------------+ //| Indicator input parameters       | //+-----------------------------------+ input uint Up_period1=3; // Period 1 for the highest prices calculation input uint Dn_period1=3; // Period 1 for the lowest prices calculation input uint Up_period2=6; // Period 2 for the highest prices calculation input uint Dn_period2=6; // Period 2 for the lowest prices calculation input uint Up_period3=9; // Period 3 for the highest prices calculation input uint Dn_period3=9; // Period 3 for the lowest prices calculation //---- input MODE_PRICE Up_mode1=HIGH;  // Price type 1 for searching for highs input MODE_PRICE Dn_mode1=LOW;   // Price type 1 for searching for lows input MODE_PRICE Up_mode2=HIGH;  // Price type 2 for searching for highs input MODE_PRICE Dn_mode2=LOW;   // Price type 2 for searching for lows input MODE_PRICE Up_mode3=HIGH;  // Price type 3 for searching for highs input MODE_PRICE Dn_mode3=LOW;  // Price type 3 for searching for lows //---- input Smooth_Method XMA1_Method=MODE_SMA; // Smoothing method 1 input Smooth_Method XMA2_Method=MODE_SMA; // Smoothing method 2 input Smooth_Method XMA3_Method=MODE_SMA; // Smoothing method 3 //---- input int XLength1=8;  // Smoothing depth 1 input int XLength2=25; // Smoothing depth 2 input int XLength3=80; // Smoothing depth 3 input int XPhase=15;   // Smoothing parameter input int Shift1=0;    // Horizontal shift of the indicator 1 in bars input int Shift2=0    // Horizontal shift of the indicator 2 in bars input int Shift3=0    // Horizontal shift of the indicator 3 in bars When it comes to smoothing algorithms, you have a choice of ten different versions: SMA - simple moving average; EMA - exponential moving average; SMMA - smoothed moving average; LWMA - linear weighted moving average; JJMA - JMA adaptive average; JurX - ultralinear smoothing; ParMA - parabolic smoothing; T3 - Tillson's multiple exponential smoothing; VIDYA - smoothing using Tushar Chande's algorithm; AMA - smoothing with Perry Kaufman's algorithm. Keep in mind that the phase parameters for different smoothing algorithms have different meanings. For instance, in JMA, the phase variable ranges from -100 to +100. For T3, it's a smoothing ratio multiplied by 100 for better visualization, while VIDYA uses a CMO oscillator period, and AMA employs a slow EMA period. For other algorithms, these parameters don't impact smoothing. For AMA, the fast EMA period is fixed at 2 by default, and the raising power ratio is also set at 2. To get started, simply place the XMA_Ichimoku.mq5 indicator compiled file in your MQL5\Indicators\ directory. Don’t forget that this indicator relies on the SmoothAlgorithms.mqh library classes, which you'll need to copy to your terminal_data_folder\MQL5\Include. You can find a detailed explanation of how to use these classes in the article titled "Averaging Price Series for Intermediate Calculations Without Using Additional Buffers".

2012.01.31
Unlocking Trading Potential with the iGDR Fractal Levels Indicator for MetaTrader 5
MetaTrader5
Unlocking Trading Potential with the iGDR Fractal Levels Indicator for MetaTrader 5

Meet the Creator: GreenDog The iGDR Fractal Levels indicator is a powerful tool designed for MetaTrader 5 that highlights the average fractal values over a set period. This handy indicator displays three distinct levels right on your chart, each marked in a unique color for easy reference. These levels are also plotted next to their respective text labels, taking into account the variations used in calculating the average values. So, how does it work? The indicator looks at a defined time interval, but it only considers a specific number of bars that you set in the parameters. It searches for fractals within this interval, calculates the three price levels with the most fractals, and identifies the price for each fractal. The average price is then calculated and displayed, with a line size that reflects the spread of the other fractal prices, indicating the most significant levels. From all the fractals identified, only three price levels are formed by the indicator. Each level is color-coded based on the number of fractals contributing to it: the strongest level is marked in red, the medium level in yellow, and the weakest in green. Don’t overlook the green level, as it can still play a role in your trading strategy. How to Use in Trading: Like all levels in the Forex market, these fractal levels don’t have any specific quirks, but it’s crucial to remember that trades are typically initiated in the direction of a fractal breakout. The same goes for these levels. Enter the market when the price breaks through these levels, as it serves as a strong signal for a potential trade. Nearby levels can also serve as initial stop-loss points or profit targets, enhancing your trading strategy.

2012.01.31
Mastering Trend Trading with the HLCrossSig Indicator for MetaTrader 5
MetaTrader5
Mastering Trend Trading with the HLCrossSig Indicator for MetaTrader 5

Author: Bigeev Rustem The HLCrossSig for WPR is a powerful trend indicator designed to help you capture market trends effectively. It’s not just any ordinary indicator; it’s packed with features that help you eliminate the psychological and emotional barriers that often hinder trading success. This tool clearly marks levels for opening trades, setting stop levels, implementing trailing stops, and determining take profit points. With HLCrossSig, you'll never second-guess your trading decisions again. By removing emotional influences, you can focus on what really matters: making profitable trades. Input Parameters: //+----------------------------------------------+ //| Input parameters for the indicator            | //+----------------------------------------------+ input int Supr_Period=6;  // Breakthrough range period; higher values mean less frequent signals input int MA_Period=21;   // Heiken Ashi variable period for additional filtering input int Risk=0;         // Maximum risk in pips for entry level calculation based on closest MAX/MIN input int ATR_Period=120; // ATR period for volatility calculation input double Q=0.7;       // Parameter for placing Take Profit; if = 1, TP = SL input int WPR_Period=12  // WPR period for additional filtering input int HLine=-38      // Upper signal line for WPR stop levels input int LLine=-62      // Lower signal line for WPR stop levels Displayed Elements of the Indicator: Up and down arrows signal when to open the corresponding positions; Circles on the crosshairs indicate points for setting initial Take Profit; Dots confirm the established trend. If the price consistently breaks these levels, hold onto your position as long as possible. If these dots create a 'corridor' over time, it might be time to take your profit; Diamonds show where to place Stop Loss and Trailing Stop.

2012.01.28
Mastering the UltraWPR Indicator for MetaTrader 5
MetaTrader5
Mastering the UltraWPR Indicator for MetaTrader 5

Author: dm34@mail.ru If you're looking to elevate your trading game, the UltraWPR indicator for MetaTrader 5 is a fantastic tool to add to your arsenal. This indicator is built on the Williams' Percent Range (WPR) and analyzes multiple signal lines to give you a clearer picture of market trends. Here’s how it works: the indicator uses a specific algorithm based on three key parameters: StartLength: This is the initial value for the first signal line. Step: This defines how much the period changes with each step. StepsTotal: This is the total number of period changes. To calculate any period value from the signal lines, we use a simple arithmetic progression: SignalPeriod(Number) = StartLength + Number * Step, In this equation, the Number variable ranges from zero to StepsTotal. The calculated values are stored in an array and utilized at each tick to produce a series of smoothed WPR values. The indicator also assesses the direction of current trends and counts the number of positive and negative trends across the smoothed array. The final trend counts are further smoothed and depicted as lines that create a color cloud, thanks to the DRAW_FILLING style class. The cloud's color indicates the trend direction while its width reflects the trend's strength. You can also set overbought (UpLevel) and oversold (DnLevel) thresholds based on the maximum amplitude of the indicator. The UltraWPR offers a selection of ten smoothing algorithms: SMA - Simple Moving Average; EMA - Exponential Moving Average; SMMA - Smoothed Moving Average; LWMA - Linear Weighted Moving Average; JJMA - JMA Adaptive Average; JurX - Ultralinear Smoothing; ParMA - Parabolic Smoothing; T3 - Tillson's Multiple Exponential Smoothing; VIDYA - Tushar Chande's Algorithm Smoothing; AMA - Perry Kaufman's Algorithm Smoothing. Keep in mind that the Phase1 and Phase2 parameters will have different meanings depending on the smoothing algorithm you choose. For instance, in JMA, the Phase variable ranges from -100 to +100. In T3, it's a smoothing ratio for better visualization, while VIDYA uses a CMO oscillator period. For AMA, the fast EMA period is fixed at 2 by default, and the raising power ratio is also set to 2. Don't forget that the UltraWPR indicator relies on the SmoothAlgorithms.mqh library classes, which you'll need to copy to your terminal’s MQL5\Include folder. You can find more details on using these classes in the article "Averaging Price Series for Intermediate Calculations Without Using Additional Buffers". To install the UltraWPR indicator, simply place the compiled file in the MQL5\Indicators folder of your terminal. Here are the input parameters for the indicator: //+----------------------------------------------+ //| Indicator input parameters                  | //+----------------------------------------------+ input int WPR_Period=13;                    // WPR indicator period //---- input Smooth_Method W_Method=MODE_JJMA;  // Smoothing method input int StartLength=3;                   // Initial smoothing period                     input int WPhase=100;                       // Smoothing parameter //----   input uint Step=5;                          // Period change step input uint StepsTotal=10;                   // Number of period changes //---- input Smooth_Method SmoothMethod=MODE_JJMA;// Smoothing method input int SmoothLength=3;                  // Smoothing depth                     input int SmoothPhase=100;                  // Smoothing parameter //----                           input uint UpLevel=80;                      // Overbought level, % input uint DnLevel=20;                      // Oversold level, % input color UpLevelsColor=Blue;             // Overbought level color input color DnLevelsColor=Blue;             // Oversold level color input STYLE Levelstyle=DASH_;              // Levels style input WIDTH  LevelsWidth=Width_1;          // Levels width

2012.01.28
Unlocking the XMA_Ichimoku Indicator for MetaTrader 5: Your Guide to Advanced Trading
MetaTrader5
Unlocking the XMA_Ichimoku Indicator for MetaTrader 5: Your Guide to Advanced Trading

Author: ellizii If you’re looking to step up your trading game, the XMA_Ichimoku indicator for MetaTrader 5 is a powerful tool that’s worth your attention. This moving average indicator is built on the same algorithm as the renowned Ichimoku Kinko Hyo, which is known for its robust trend analysis capabilities. Key Input Parameters //+-----------------------------------+ //| Indicator input parameters       | //+-----------------------------------+ input uint Up_period=3;                  // Period for calculating high prices input uint Dn_period=3;                  // Period for calculating low prices //---- input MODE_PRICE Up_mode=HIGH;           // Price mode for highs input MODE_PRICE Dn_mode=LOW;            // Price mode for lows //---- input Smooth_Method XMA_Method=MODE_SMA; // Choose the smoothing method input int XLength=8;                     // Depth of smoothing input int XPhase=15;                     // Parameter for smoothing input int Shift=0;                       // Horizontal shift in bars input int PriceShift=0;                  // Vertical shift in points Smoothing Algorithm Options When it comes to smoothing, you have a variety of choices to fine-tune your indicator: SMA - Simple Moving Average EMA - Exponential Moving Average SMMA - Smoothed Moving Average LWMA - Linear Weighted Moving Average JJMA - JMA Adaptive Average JurX - Ultralinear Smoothing ParMA - Parabolic Smoothing T3 - Tillson's Multiple Exponential Smoothing VIDYA - Tushar Chande's Algorithm AMA - Perry Kaufman's Algorithm Keep in mind that the Phase parameters vary greatly depending on the smoothing method you choose. For instance, with JMA, the Phase changes from -100 to +100, while for T3, it’s a smoothing ratio multiplied by 100. Understanding these nuances can really enhance your trading strategy. The XMA_Ichimoku indicator leverages the SmoothAlgorithms.mqh library classes, which you’ll need to copy into your terminal's terminal_data_folder\MQL5\Include. You can find a detailed explanation of these classes in the article "Averaging Price Series for Intermediate Calculations Without Using Additional Buffers". This indicator first appeared in MQL4 and was published in the Code Base on September 19, 2010.

2012.01.28
ColorXWPR: Enhance Your MetaTrader 5 Experience with This Powerful Indicator
MetaTrader5
ColorXWPR: Enhance Your MetaTrader 5 Experience with This Powerful Indicator

Exciting news for traders! The latest version of Larry Williams' Percent Range (WPR) now comes with a signal line feature and the flexibility to select different price time series. This versatile indicator lets you tweak your smoothing method to suit your trading style: SMA - Simple Moving Average; EMA - Exponential Moving Average; SMMA - Smoothed Moving Average; LWMA - Linear Weighted Moving Average; JJMA - JMA Adaptive Average; JurX - Ultralinear Smoothing; ParMA - Parabolic Smoothing; T3 - Tillson's Multiple Exponential Smoothing; VIDYA - Smoothing using Tushar Chande's Algorithm; AMA - Smoothing using Perry Kaufman's Algorithm. Keep in mind that the Phase type parameters vary significantly depending on the smoothing algorithm you choose. For instance, in JMA, it's an external Phase variable that ranges from -100 to +100. With T3, it's a smoothing ratio scaled up by 100 for better visualization. VIDYA uses a CMO oscillator period, while AMA relies on a fixed slow EMA period set to 2 by default. The raising power ratio is also set to 2 for AMA, ensuring consistency. To get the most out of this indicator, you'll need to utilize the SmoothAlgorithms.mqh library classes (be sure to copy them to your terminal_data_folder\MQL5\Include). For a detailed guide on how to leverage these classes, check out the article "Averaging Price Series for Intermediate Calculations Without Using Additional Buffers".

2012.01.26
First Previous 244 245 246 247 248 249 250 251 252 253 254 Next Last