The KDJ oscillator is a handy tool for traders looking to pinpoint the perfect market entry conditions.
This indicator comes with four key inputs:
- Period - the timeframe for calculations;
- KFactor - the ratio used for calculating the K line;
- DFactor - the ratio used for calculating the D line;
- Threshold - the signal line to watch out for.
Here’s how the calculation works:
K = KFactor * PrevK + DFactor * RSV
D = KFactor * PrevD + DFactor * K
J = 3.0 * D - 2.0 * K
In this formula:
RSV = ((Close – Lowest Low) / (Highest High – Lowest Low)) * 100
Lowest Low and Highest High refer to the lowest and highest prices within the specified Period.
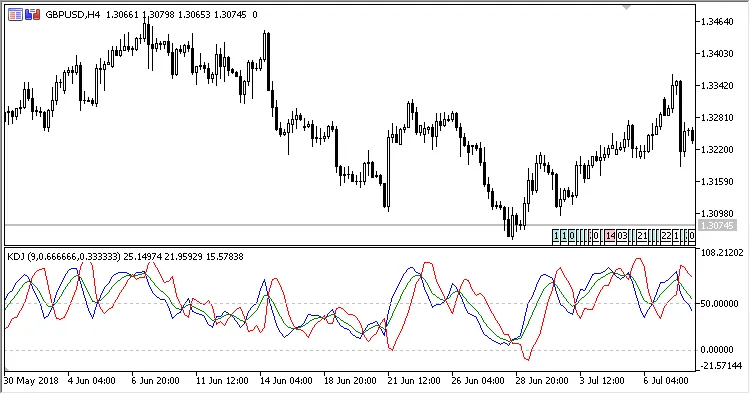
A common interpretation of the KDJ indicator is when the J line crosses the Threshold level. If it moves upwards, it’s a signal to consider selling; if it dips downwards, it’s time to look for buying opportunities.