The KDJ Averages oscillator is a handy tool for traders looking to identify market entry points. Unlike the traditional KDJ, this version uses standard smoothing techniques, making its J line a tad quicker to respond under default settings.
Here’s a quick rundown of the six input parameters you’ll be working with:
- KDJ Period - The time frame for calculating the KDJ indicator;
- K Period - The time frame for the K line calculations;
- K Method - The method used for calculating the K line;
- D Period - The time frame for the D line calculations;
- D Method - The method used for calculating the D line;
- Threshold - This sets the signal line.
Calculation:
K = MA(RSV, KPeriod, KMethod)
D = MA(K, DPeriod, DMethod)
J = 3.0*D - 2.0*K
Where:
RSV = ((Close – Lowest Low) / (Highest High – Lowest Low)) * 100
Here, the Lowest Low and Highest High refer to the lowest and highest prices during the specified period.
Interpreting the Data: Watch for the J line as it crosses the Threshold level. A move upward suggests a selling opportunity, while downward movement indicates a good moment to buy.
Once the J line crosses the Threshold, keep an eye out for the K and D lines to follow suit. The direction they cross will guide your market entry decision.
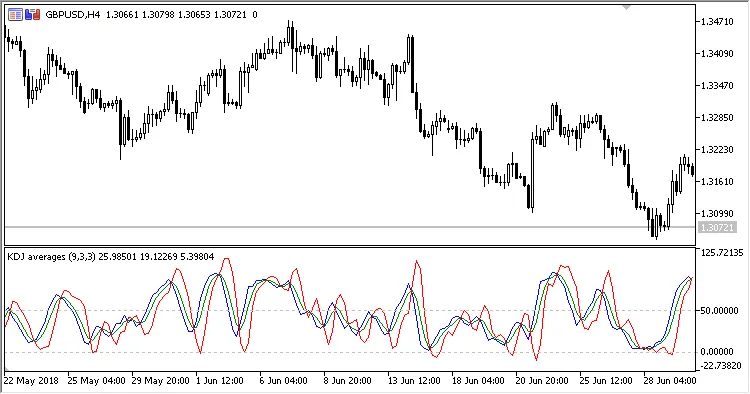
Fig. 1. KDJ Averages
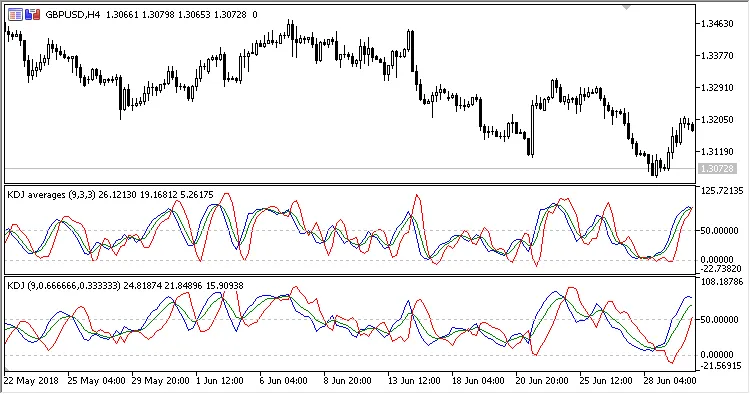
Fig. 2. KDJ Averages compared with KDJ
Related Posts
- Unlocking the Power of Master Tools for MetaTrader 4
- Mastering the MACD Candle Indicator for MetaTrader 4
- Unlock Trading Insights with Volume Profile + Range v6.0 for MetaTrader 5
- Hourly Buffers for Data Collection in MetaTrader 5: A Simple Guide
- Mastering the FE Fibonacci Expansion Indicator for MetaTrader 4