Hey fellow traders! Today, let’s dive into a topic that often gets overlooked: the Normalized Relative Strength Index (RSI) and how it can enhance your trading strategy on MetaTrader 5.
Now, we all know that some indicators function consistently across different calculation lengths, but the RSI is not one of them. While it’s well-known for oscillating between 0 and 100 (making it technically normalized), serious traders often caution against using lengths greater than 10.
The RSI Dilemma
So, what's the big deal with RSI? The longer the calculation period you use, the flatter the RSI tends to become. Here’s a visual for you—a 50-period RSI:
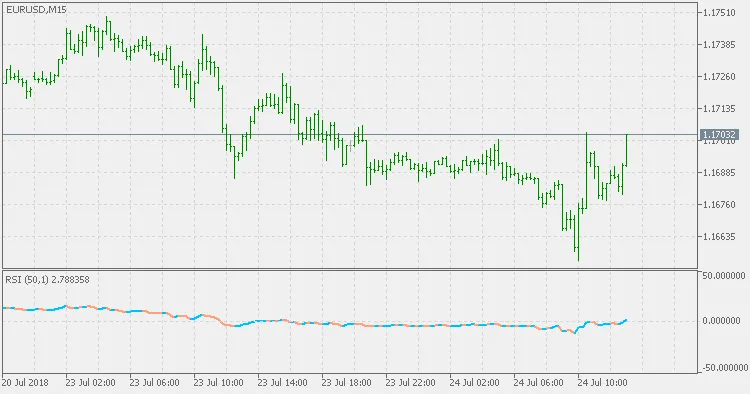
As you can see, this long calculation period makes it nearly unusable in its original form. Over the years, traders have tried various tweaks to fix this issue. There’s the Smoothed RSI, which partially addresses the problem but quickly loses its edge compared to the standard RSI. Then there’s the Inverse Fisher Transform of RSI, which also flattens out over time. Here’s a comparison of the 50-period RSI versus the Inverse Fisher Transform of the 50 RSI:
Introducing Normalized RSI
But here’s where it gets interesting! We can normalize the RSI into a range of -50 to +50. Check out this example:
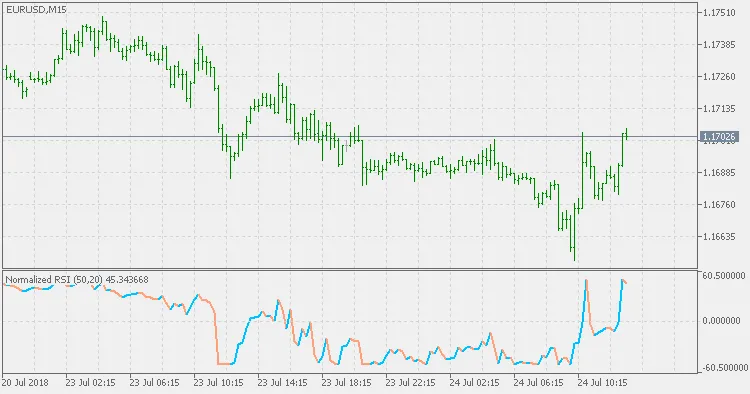
This normalization helps address some of the issues we’ve discussed, particularly the notorious flattening effect.
As always, I recommend doing some experimenting on your own. Testing different settings can really open up new avenues for your trading strategy!
Happy trading, and may your charts always be in your favor!
Related Posts
- Unlocking the Power of Master Tools for MetaTrader 4
- Mastering the MACD Candle Indicator for MetaTrader 4
- Unlocking MetaCOT 2: Your Ultimate CFTC Indicator Toolkit for MT4
- Mastering the Fibonacci ZigZag Indicator for MetaTrader 5
- Unlock Trading Insights with Volume Profile + Range v6.0 for MetaTrader 5