Hey there, fellow traders! Today, we’re diving into the exciting world of FiboPivot, a tool that can really enhance your trading strategy. Whether you're a seasoned pro or just starting out, understanding how to leverage Fibonacci levels can give you an edge in the market.
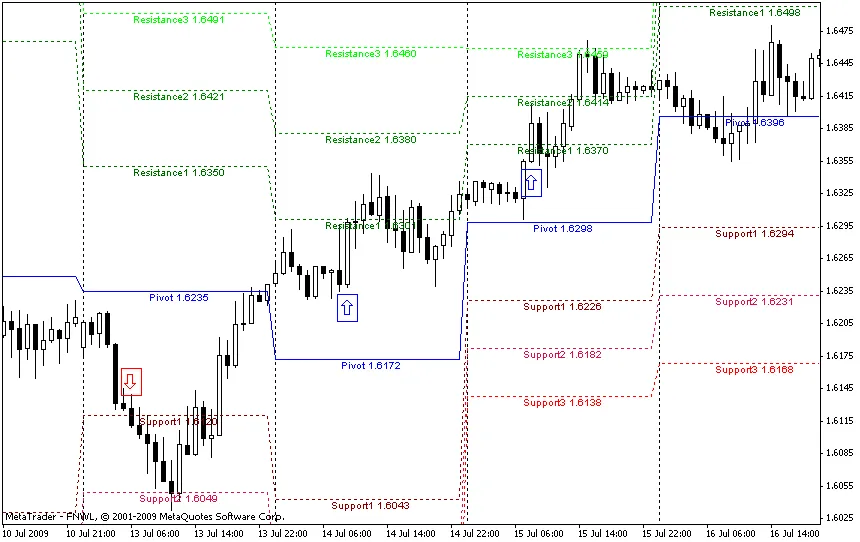
One of the cool features of this tool is that it allows you to customize the Fibonacci grid settings and manage how the levels are displayed on your charts. Take a look at the arrows in the image below; they indicate recommended trade setups. Just a heads up, these suggestions are based on analysis and are not part of the indicator itself.
We’ve also introduced a second version of the indicator, which displays Fibonacci levels as percentages instead of just naming the levels. This can make it easier to gauge how far the price has moved relative to those levels!
For those of you looking to dive deeper, check out the link below for a visual guide:
- Customize Fibonacci grid settings
- Manage level display options
- Utilize trade recommendations
- Explore percentage-based level display