Kijun Sen Candles Two Colors: Now Available for MT5!
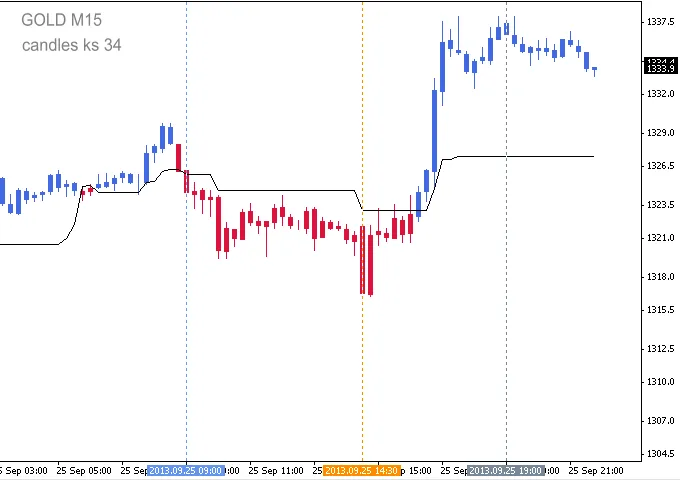
This nifty Indicator paints different colored candles above and below the Kijun Sen (KS) line, giving you a clearer view of market movements.
Important: Make sure the Kijun Sen period on both this Indicator and your custom Kijun Sen match perfectly for accurate readings!
This updated version automatically switches the chart to a Line Chart and sets the chart color to None before displaying the Kijun Sen Candles, making your setup a breeze. So, you can skip those initial setup steps from 1 to 7!
How to Set Up Your Kijun Sen Candles Indicator
- Open a new chart.
- Change the chart price graphic to a Line Chart by pressing Alt + 3 or navigating to 'Charts' in the top menu and selecting 'Line Chart'. Ensure 'Bar Chart' or 'Candlesticks' isn't accidentally selected.
- Access the Chart Properties window by pressing F8 or right-clicking anywhere on the chart and choosing 'Properties'.
- Go to the Colors tab.
- Under 'Line Chart:', click the dropdown and change the color to 'None'. Your chart should now be blank.
- Consider saving this blank chart as a template for future use with other currency pairs or instruments.
- Attach the Kijun Sen Candles Indicator to your blank chart.
Included Kijun Sen Indicators
In the zip file above, you'll find predefined Kijun Sen Indicators for periods 21, 34, 50, and 100.
Image Reference: First vertical line marks the London Open at 08:00 (03:00 ET), and the second vertical line denotes the London 13:30 (08:30 ET - US News Release).
Candle Accuracy
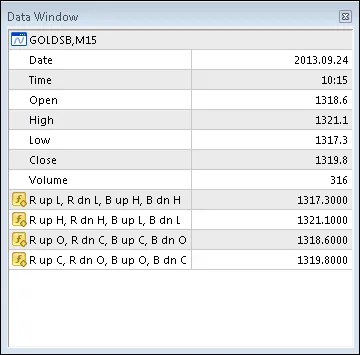
Even though the standard chart price graphic is hidden, it's still active. You can access Open, High, Low, and Close prices via the MT4 Data Window (press Ctrl+D or go to View → Data Window). Always cross-check the accuracy of the Indicator's Open, High, Low, and Close prices against those in the Data Window by ensuring your cursor is on the relevant colored candle.
Data Window Interpretation
- Hidden candle Open: 1318.6
- Hidden candle High: 1321.1
- Hidden candle Low: 1317.3
- Hidden candle Close: 1319.8
The indicator's candle values are listed in Columns R up, R dn, B up, and B dn (Red up candle, Red down, Blue up candle, Blue down candle). Since the hidden candle's open is less than its close, it’s classified as an up candle, aligning with the indicator’s Red up candle in column 1.
- R up L: 1317.3
- B up H: 1321.1
- R up O: 1318.6
- R up C: 1319.8
Customizing Inputs and Parameters
All input parameters and options are adjustable and will save automatically. Just a heads up: if you reset after changing Inputs or Color parameters, the Color Candles will revert to Bars. To get back to Color Candles, simply switch to a different timeframe and then back again.
- Candle_Kijun_Sen - 35;
- Candle_Shadow_Width - 1;
- Candle_Body_Width - 3;
Related Posts
- Unlocking the Power of Master Tools for MetaTrader 4
- Unlocking MetaCOT 2: Your Ultimate CFTC Indicator Toolkit for MT4
- ID Lite Info MA: A Comprehensive Indicator for MetaTrader 5
- Predicting Future Prices with Neural Networks: Your Guide to BPNN
- How to Use the Change Chart Symbol Menu for MetaTrader 4