If you're looking to gain an edge in your trading, the PGC indicator for MetaTrader 5 is a powerful tool that can help you spot cyclic changes in the market. Let's dive into how it works!
Features of the PGC Indicator
The PGC comes packed with seven adjustable parameters, allowing you to tailor it to your trading strategy:
- First MA period - This sets the period for the first Exponential Moving Average (EMA).
- Second MA period - This defines the period for the second EMA.
- Smoothing period - Use this to smooth out your indicator signals.
- RSI period - This determines the period for calculating the Relative Strength Index (RSI).
- Applied price - Choose the price that will be used for calculations.
- Overbought level - Set your threshold for overbought conditions.
- Oversold level - Set your threshold for oversold conditions.
How the PGC Indicator Calculates Signals
Here’s a quick rundown of the calculation behind the PGC:
PGC = 100.0 - 100.0 / (1.0 + RS)
Where:
if AvgDec != 0
RS = AvgInc / AvgDec
otherwise
RS = 0
AvgDec = EMA(Dec, RSI Period)
AvgInc = EMA(Inc, RSI Period)
If Z3 > PrevZ3
Inc = Z3 - PrevZ3, Dec = 0
If Z3 < PrevZ3
Dec = PrevZ3 - Z3, Inc = 0
Z3 = 2.0 * AvgMA3 - Avg2MA3
Avg2MA3 = EMA(AvgMA3, Smoothing period)
AvgMA3 = EMA((Z1 - Z2), Smoothing period)
Z2 = 2.0 * MA2 - AvgMA2
Z1 = 2.0 * MA1 - AvgMA1
AvgMA2 = EMA(MA2, First MA period)
AvgMA1 = EMA(MA1, First MA period)
MA2 = EMA(Applied price, Second MA period)
MA1 = EMA(Applied price, First MA period)
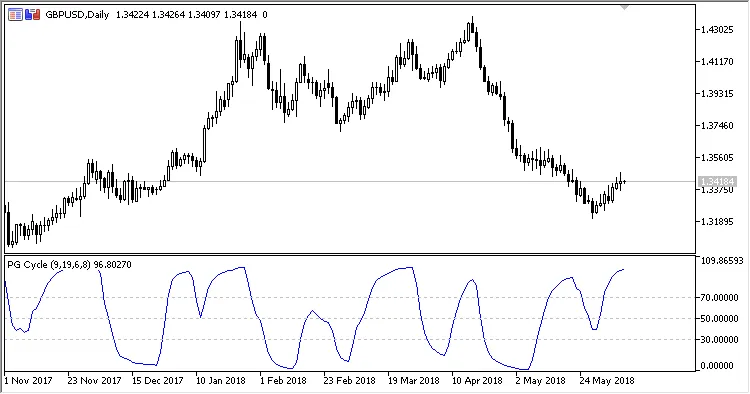
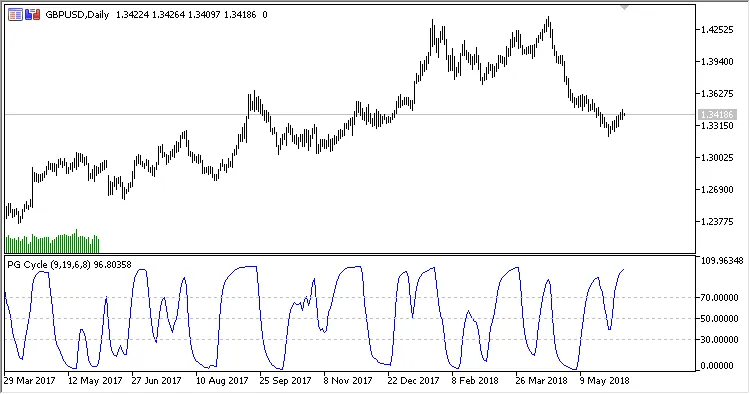
Visualizing the PGC Indicator
Check out the images below to see the PGC in action:
Related Posts
- Mastering the Two Pole Smoothed Ehlers Oscillator for Better Trading
- Understanding the Cycle Period Indicator for MetaTrader 5
- Unlocking the Decycler Oscillator: A Game-Changer for MetaTrader 5 Traders
- Unlock Trading Insights with the Stochastic Cyber Cycle Indicator for MetaTrader 5
- Unlocking MetaCOT 2: Your Ultimate CFTC Indicator Toolkit for MT4